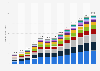
In 2024, the e-commerce category encompassing food, beverages, and cleaning items accounted for more than **** trillion Argentine pesos, which makes it the second best-selling online segment after travel tickets and tourism. Argentina's e-commerce sector generated a revenue of over ** trillion pesos, including business-to-consumer (B2C) and customer-to-customer (C2C) sales in 2024.
The original question posed on the survey was: "Regarding the product categories you offer online, please indicate the revenue for each of them (including VAT)". Figures have been rounded.
Profit from the additional features of your individual account
Currently, you are using a shared account. To use individual functions (e.g., mark statistics as favourites, set
statistic alerts) please log in with your personal account.
If you are an admin, please authenticate by logging in again.
Learn more about how Statista can support your business.
CACE. (February 10, 2025). Retail e-commerce sales in Argentina from 2019 to 2024, by category (in billion Argentine pesos) [Graph]. In Statista. Retrieved July 22, 2025, from https://www.statista.com/statistics/695529/annual-online-retail-e-commerce-sales-argentina-category/
CACE. "Retail e-commerce sales in Argentina from 2019 to 2024, by category (in billion Argentine pesos)." Chart. February 10, 2025. Statista. Accessed July 22, 2025. https://www.statista.com/statistics/695529/annual-online-retail-e-commerce-sales-argentina-category/
CACE. (2025). Retail e-commerce sales in Argentina from 2019 to 2024, by category (in billion Argentine pesos). Statista. Statista Inc.. Accessed: July 22, 2025. https://www.statista.com/statistics/695529/annual-online-retail-e-commerce-sales-argentina-category/
CACE. "Retail E-commerce Sales in Argentina from 2019 to 2024, by Category (in Billion Argentine Pesos)." Statista, Statista Inc., 10 Feb 2025, https://www.statista.com/statistics/695529/annual-online-retail-e-commerce-sales-argentina-category/
CACE, Retail e-commerce sales in Argentina from 2019 to 2024, by category (in billion Argentine pesos) Statista, https://www.statista.com/statistics/695529/annual-online-retail-e-commerce-sales-argentina-category/ (last visited July 22, 2025)
Retail e-commerce sales in Argentina from 2019 to 2024, by category (in billion Argentine pesos) [Graph], CACE, February 10, 2025. [Online]. Available: https://www.statista.com/statistics/695529/annual-online-retail-e-commerce-sales-argentina-category/