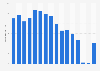
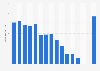
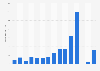
In financial year 2023, the total passenger traffic at Mumbai port in India stood at 182.6 thousand, from both overseas and costal passengers. This was an increase compared to the previous fiscal year. After seven years of no traffic, the port reported coastal traffic in 2019 and 2020, reflecting a significant year-on-year increase.
Advertisement
Advertisement
Total passenger traffic at Mumbai Port in India from financial year 2008 to 2023
(in 1,000s)
Characteristic
Passenger traffic in thousands
FY 2023
182.6
FY 2022
98.3
FY 2021
0
FY 2020
175.1
FY 2019
48.9
FY 2018
21.5
FY 2017
17.4
FY 2016
3.2
FY 2015
7.9
FY 2014
3
FY 2013
5.6
FY 2012
4.7
FY 2011
15.9
0255075100125150175200225
Add this content to your personal favorites. These can be accessed from the favorites menu in the main navigation.
You have no right to use this feature.
Make sure to contact us if you are interested in scientific citation.
You can upgrade your account to enable this functionality for all statistics.
This feature is not available with your current account.Request access
Note: India's financial year begins in April and ends in March. For example, FY 2008 started in April 2007 and ended in March 2008.
Major ports are under the union list while the non-major ports are under the concurrent list of the constitution of India. Therefore, major ports are under the administrative control of government of India while the non-major ports are governed by the respective maritime state governments.
Learn more about how Statista can support your business.
Ministry of Ports, Shipping and Waterways (India). (July 24, 2024). Total passenger traffic at Mumbai Port in India from financial year 2008 to 2023 (in 1,000s) [Graph]. In Statista. Retrieved July 18, 2025, from https://www.statista.com/statistics/696873/total-passenger-traffic-in-mumbai-port-india/
Ministry of Ports, Shipping and Waterways (India). "Total passenger traffic at Mumbai Port in India from financial year 2008 to 2023 (in 1,000s)." Chart. July 24, 2024. Statista. Accessed July 18, 2025. https://www.statista.com/statistics/696873/total-passenger-traffic-in-mumbai-port-india/
Ministry of Ports, Shipping and Waterways (India). (2024). Total passenger traffic at Mumbai Port in India from financial year 2008 to 2023 (in 1,000s). Statista. Statista Inc.. Accessed: July 18, 2025. https://www.statista.com/statistics/696873/total-passenger-traffic-in-mumbai-port-india/
Ministry of Ports, Shipping and Waterways (India). "Total Passenger Traffic at Mumbai Port in India from Financial Year 2008 to 2023 (in 1,000s)." Statista, Statista Inc., 24 Jul 2024, https://www.statista.com/statistics/696873/total-passenger-traffic-in-mumbai-port-india/
Ministry of Ports, Shipping and Waterways (India), Total passenger traffic at Mumbai Port in India from financial year 2008 to 2023 (in 1,000s) Statista, https://www.statista.com/statistics/696873/total-passenger-traffic-in-mumbai-port-india/ (last visited July 18, 2025)
Total passenger traffic at Mumbai Port in India from financial year 2008 to 2023 (in 1,000s) [Graph], Ministry of Ports, Shipping and Waterways (India), July 24, 2024. [Online]. Available: https://www.statista.com/statistics/696873/total-passenger-traffic-in-mumbai-port-india/
Advertisement
Profit from additional features with an Employee Account
Please create an employee account to be able to mark statistics as favorites.
Then you can access your favorite statistics via the star in the header.
Profit from the additional features of your individual account
Currently, you are using a shared account. To use individual functions (e.g., mark statistics as favourites, set
statistic alerts) please log in with your personal account.
If you are an admin, please authenticate by logging in again.