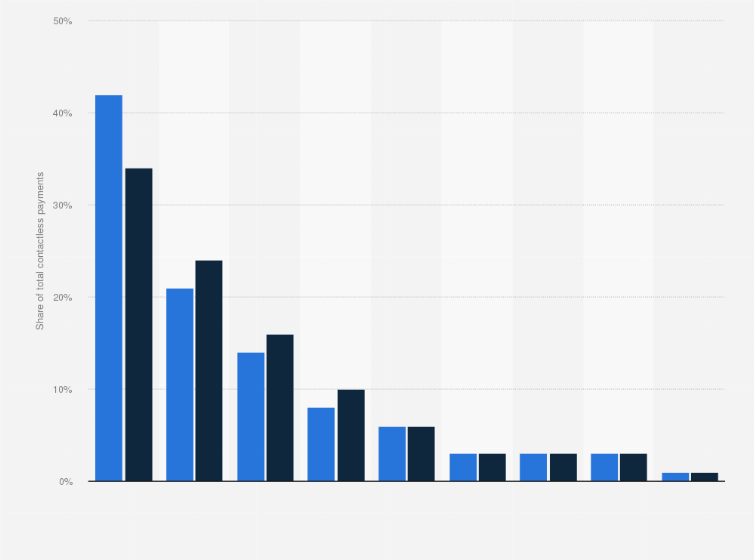
This statistic shows the distribution of contactless payments in the Netherlands in 2015 and 2016, by transaction amount. In 2015, approximately five percent of all contactless payments were amounts between 20 and 25 euros.
Adjust the presentation of the statistic and data points.
Share the statistic on social media channels or embed the statistic in your
website using "Embed Code", where available.
Cite this statistic and select one of the following formats: APA, Chicago, Harvard, MLA & Bluebook.
Print the statistic including description and metadata.
Chart type
Distribution of contactless payments in the Netherlands in 2015 and 2016, by transaction amount
Share this statistic
You have no right to use this feature.
Make sure to contact us if you are interested in scientific citation.
You can upgrade your account to enable this functionality for all statistics.
This feature is not available with your current account.Request access
The source states that the total number of contactless payments reached a value of 135 million transactions in 2015 and 630 million transactions in 2016.
The source states that the numbers provided concern payments "made at points of sales – e.g. shops, bars, restaurants, hotels, petrol stations, services, markets, vending machines – and person-to-person payments". Purchases from online shops and bank transfers between consumers were excluded from the survey.
Learn more about how Statista can support your business.
DNB, & The Dutch Payments Association. (April 7, 2017). Distribution of contactless payments in the Netherlands in 2015 and 2016, by transaction amount [Graph]. In Statista. Retrieved May 27, 2025, from https://www.statista.com/statistics/697653/distribution-of-contactless-payments-in-the-netherlands-by-transaction-amount/
DNB, und The Dutch Payments Association. "Distribution of contactless payments in the Netherlands in 2015 and 2016, by transaction amount." Chart. April 7, 2017. Statista. Accessed May 27, 2025. https://www.statista.com/statistics/697653/distribution-of-contactless-payments-in-the-netherlands-by-transaction-amount/
DNB, The Dutch Payments Association. (2017). Distribution of contactless payments in the Netherlands in 2015 and 2016, by transaction amount. Statista. Statista Inc.. Accessed: May 27, 2025. https://www.statista.com/statistics/697653/distribution-of-contactless-payments-in-the-netherlands-by-transaction-amount/
DNB, and The Dutch Payments Association. "Distribution of Contactless Payments in The Netherlands in 2015 and 2016, by Transaction Amount." Statista, Statista Inc., 7 Apr 2017, https://www.statista.com/statistics/697653/distribution-of-contactless-payments-in-the-netherlands-by-transaction-amount/
DNB & The Dutch Payments Association, Distribution of contactless payments in the Netherlands in 2015 and 2016, by transaction amount Statista, https://www.statista.com/statistics/697653/distribution-of-contactless-payments-in-the-netherlands-by-transaction-amount/ (last visited May 27, 2025)
Distribution of contactless payments in the Netherlands in 2015 and 2016, by transaction amount [Graph], DNB, & The Dutch Payments Association, April 7, 2017. [Online]. Available: https://www.statista.com/statistics/697653/distribution-of-contactless-payments-in-the-netherlands-by-transaction-amount/
Profit from additional features with an Employee Account
Please create an employee account to be able to mark statistics as favorites.
Then you can access your favorite statistics via the star in the header.
Profit from the additional features of your individual account
Currently, you are using a shared account. To use individual functions (e.g., mark statistics as favourites, set
statistic alerts) please log in with your personal account.
If you are an admin, please authenticate by logging in again.