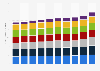
The statistic shows the frequency at which women in the United States wear sports bras in 2017, by age. The survey revealed that ** percent of women in the U.S., aged 36 to 50 years, wear sports bras several times per week.
Profit from the additional features of your individual account
Currently, you are using a shared account. To use individual functions (e.g., mark statistics as favourites, set
statistic alerts) please log in with your personal account.
If you are an admin, please authenticate by logging in again.
Learn more about how Statista can support your business.
Statista Survey. (April 3, 2017). Frequency at which women in the United States wear sports bras in 2017, by age [Graph]. In Statista. Retrieved July 25, 2025, from https://www.statista.com/statistics/697983/frequency-at-which-women-wear-sports-bras-by-age-us/
Statista Survey. "Frequency at which women in the United States wear sports bras in 2017, by age." Chart. April 3, 2017. Statista. Accessed July 25, 2025. https://www.statista.com/statistics/697983/frequency-at-which-women-wear-sports-bras-by-age-us/
Statista Survey. (2017). Frequency at which women in the United States wear sports bras in 2017, by age. Statista. Statista Inc.. Accessed: July 25, 2025. https://www.statista.com/statistics/697983/frequency-at-which-women-wear-sports-bras-by-age-us/
Statista Survey. "Frequency at Which Women in The United States Wear Sports Bras in 2017, by Age." Statista, Statista Inc., 3 Apr 2017, https://www.statista.com/statistics/697983/frequency-at-which-women-wear-sports-bras-by-age-us/
Statista Survey, Frequency at which women in the United States wear sports bras in 2017, by age Statista, https://www.statista.com/statistics/697983/frequency-at-which-women-wear-sports-bras-by-age-us/ (last visited July 25, 2025)
Frequency at which women in the United States wear sports bras in 2017, by age [Graph], Statista Survey, April 3, 2017. [Online]. Available: https://www.statista.com/statistics/697983/frequency-at-which-women-wear-sports-bras-by-age-us/