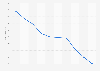
In the fiscal year 2023, approximately **** percent of the Japanese population was served by wastewater treatment systems, indicating a steady increase since fiscal 2013. Reaching almost *** percent, ***** Prefecture had the highest population share with access to wastewater treatment in that year.
fiscal year 2014 to 2023; the Japanese fiscal year starts on April 1 of the stated year and ends on March 31 of the following year
Supplementary notes
**In fiscal year 2011, Iwate and Fukushima prefectures were out of the scope of the survey to tabulate because the prefectures were affected by the Great East Japan Earthquake.
***In fiscal year 2012, 2013 and 2014, Fukushima prefecture was out of the scope of the survey to tabulate because the prefecture was affected by the Great East Japan Earthquake.
****In fiscal year 2015, the following cities, towns and villages in Fukushima prefecture couldn't be surveyed because the municipalities were affected by the Great East Japan Earthquake: Soma, Minamisoma, Hirono, Naraha, Tomioka, Kawauchi, Okuma, Futaba, Namie, Katsurao and Iitate.
Figures prior to fiscal year 2021 come from previous reporting.
Profit from the additional features of your individual account
Currently, you are using a shared account. To use individual functions (e.g., mark statistics as favourites, set
statistic alerts) please log in with your personal account.
If you are an admin, please authenticate by logging in again.
Learn more about how Statista can support your business.
MOE (Japan). (August 31, 2024). Share of population served by wastewater treatment systems in Japan from fiscal year 2014 to 2023 [Graph]. In Statista. Retrieved June 27, 2025, from https://www.statista.com/statistics/700287/japan-population-rate-served-by-wastewater-treatment-systems/
MOE (Japan). "Share of population served by wastewater treatment systems in Japan from fiscal year 2014 to 2023." Chart. August 31, 2024. Statista. Accessed June 27, 2025. https://www.statista.com/statistics/700287/japan-population-rate-served-by-wastewater-treatment-systems/
MOE (Japan). (2024). Share of population served by wastewater treatment systems in Japan from fiscal year 2014 to 2023. Statista. Statista Inc.. Accessed: June 27, 2025. https://www.statista.com/statistics/700287/japan-population-rate-served-by-wastewater-treatment-systems/
MOE (Japan). "Share of Population Served by Wastewater Treatment Systems in Japan from Fiscal Year 2014 to 2023." Statista, Statista Inc., 31 Aug 2024, https://www.statista.com/statistics/700287/japan-population-rate-served-by-wastewater-treatment-systems/
MOE (Japan), Share of population served by wastewater treatment systems in Japan from fiscal year 2014 to 2023 Statista, https://www.statista.com/statistics/700287/japan-population-rate-served-by-wastewater-treatment-systems/ (last visited June 27, 2025)
Share of population served by wastewater treatment systems in Japan from fiscal year 2014 to 2023 [Graph], MOE (Japan), August 31, 2024. [Online]. Available: https://www.statista.com/statistics/700287/japan-population-rate-served-by-wastewater-treatment-systems/