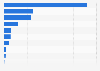
Alfa Group, a Mexican multinational conglomerate, generated 17.54 billion U.S. dollars in net sales in 2019, down from 19.06 billion recorded a year earlier. From the time series displayed, the year in which Alfa group recorded the highest net sales was 2018 with 19.06 billion U.S. dollars.
Net sales generated by Alfa Group from 2014 to 2019
(in billion U.S. dollars)
Profit from the additional features of your individual account
Currently, you are using a shared account. To use individual functions (e.g., mark statistics as favourites, set
statistic alerts) please log in with your personal account.
If you are an admin, please authenticate by logging in again.
Learn more about how Statista can support your business.
Alfa. (February 28, 2020). Net sales generated by Alfa Group from 2014 to 2019 (in billion U.S. dollars) [Graph]. In Statista. Retrieved May 09, 2025, from https://www.statista.com/statistics/709211/alfa-revenue/
Alfa. "Net sales generated by Alfa Group from 2014 to 2019 (in billion U.S. dollars)." Chart. February 28, 2020. Statista. Accessed May 09, 2025. https://www.statista.com/statistics/709211/alfa-revenue/
Alfa. (2020). Net sales generated by Alfa Group from 2014 to 2019 (in billion U.S. dollars). Statista. Statista Inc.. Accessed: May 09, 2025. https://www.statista.com/statistics/709211/alfa-revenue/
Alfa. "Net Sales Generated by Alfa Group from 2014 to 2019 (in Billion U.S. Dollars)." Statista, Statista Inc., 28 Feb 2020, https://www.statista.com/statistics/709211/alfa-revenue/
Alfa, Net sales generated by Alfa Group from 2014 to 2019 (in billion U.S. dollars) Statista, https://www.statista.com/statistics/709211/alfa-revenue/ (last visited May 09, 2025)
Net sales generated by Alfa Group from 2014 to 2019 (in billion U.S. dollars) [Graph], Alfa, February 28, 2020. [Online]. Available: https://www.statista.com/statistics/709211/alfa-revenue/