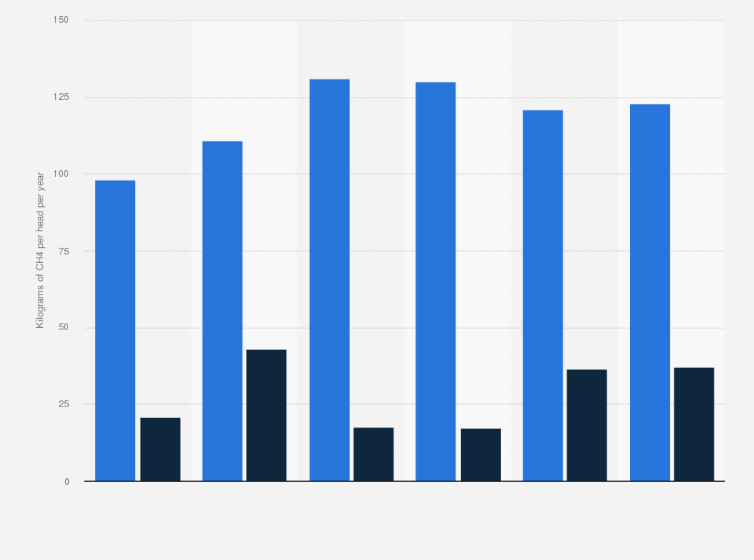
Implied emission factor of dairy cattle in the United Kingdom (UK) 1990-2017
This statistic shows the implied emission factor of dairy cattle in the United Kingdom (UK) from 1990 to 2017, in kilogram per head of cattle per year. It shows that the emission factor of manure management increase significantly in 2012 to 43 kilogram per head in that year, but decreased again in 2014 to 17.5 kilogram per head. The implied emission factor of enteric fermentation increased overall in this period and amounted to 131 kilograms per head of cattle in 2014.
As of June 2015, there were approximately 1.9 million dairy cows in the United Kingdom.
As of June 2015, there were approximately 1.9 million dairy cows in the United Kingdom.