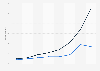
In 2024, 14.2 percent of Millennials in the United States stated that they identify as LGBTQ+, while in 2012, less than six percent of respondents from the same generation said the same. Members of Generation Z were the most likely to identify as LGBTQ+, at over 23 percent.
Advertisement
Advertisement
Share of respondents who identified as lesbian, gay, bisexual, transgender, or something other than heterosexual in the United States from 2012 to 2024, by generation
Characteristic
Generation Z (1997-2004)
Millennials (1980-1996)
Generation X (1965-1980)
Baby boomers (1946-1964)
Silent Generation (1945 and earlier)
2024
23.1%
14.2%
5.1%
3%
1.8%
2023
22.3%
9.8%
4.5%
2.3%
1.1%
2022
19.7%
11.2%
3.3%
2.7%
1.7%
2021
20.8%
10.5%
4.2%
2.6%
0.8%
2020
15.9%
9.1%
3.8%
2%
1.3%
2017
-
8.2%
3.5%
2.4%
1.4%
2016
-
7.3%
3.2%
2.4%
1.4%
2015
-
6.7%
3.3%
2.6%
1.5%
2014
-
6.3%
3.4%
2.7%
1.9%
2013
-
6%
3.3%
2.7%
1.8%
2012
-
5.8%
3.2%
2.7%
1.8%
0%5%10%15%20%25%
Add this content to your personal favorites. These can be accessed from the favorites menu in the main navigation.
Adjust the presentation of the statistic and data points.
Share the statistic on social media channels or embed the statistic in your
website using "Embed Code", where available.
Cite this statistic and select one of the following formats: APA, Chicago, Harvard, MLA & Bluebook.
Print the statistic including description and metadata.
Chart type
Share of respondents who identified as lesbian, gay, bisexual, transgender, or something other than heterosexual in the United States from 2012 to 2024, by generation
You have no right to use this feature.
Make sure to contact us if you are interested in scientific citation.
You can upgrade your account to enable this functionality for all statistics.
This feature is not available with your current account.Request access
*Number of respondents in 2024. The source does not provide the exact number of respondents for each year. Respondents were asked about their personal identification as lesbian, gay, bisexual, transgender, or something other than heterosexual.
Learn more about how Statista can support your business.
Gallup. (February 20, 2025). Share of respondents who identified as lesbian, gay, bisexual, transgender, or something other than heterosexual in the United States from 2012 to 2024, by generation [Graph]. In Statista. Retrieved July 19, 2025, from https://www.statista.com/statistics/719685/american-adults-who-identify-as-homosexual-bisexual-transgender-by-generation/
Gallup. "Share of respondents who identified as lesbian, gay, bisexual, transgender, or something other than heterosexual in the United States from 2012 to 2024, by generation." Chart. February 20, 2025. Statista. Accessed July 19, 2025. https://www.statista.com/statistics/719685/american-adults-who-identify-as-homosexual-bisexual-transgender-by-generation/
Gallup. (2025). Share of respondents who identified as lesbian, gay, bisexual, transgender, or something other than heterosexual in the United States from 2012 to 2024, by generation. Statista. Statista Inc.. Accessed: July 19, 2025. https://www.statista.com/statistics/719685/american-adults-who-identify-as-homosexual-bisexual-transgender-by-generation/
Gallup. "Share of Respondents Who Identified as Lesbian, Gay, Bisexual, Transgender, or Something Other than Heterosexual in The United States from 2012 to 2024, by Generation." Statista, Statista Inc., 20 Feb 2025, https://www.statista.com/statistics/719685/american-adults-who-identify-as-homosexual-bisexual-transgender-by-generation/
Gallup, Share of respondents who identified as lesbian, gay, bisexual, transgender, or something other than heterosexual in the United States from 2012 to 2024, by generation Statista, https://www.statista.com/statistics/719685/american-adults-who-identify-as-homosexual-bisexual-transgender-by-generation/ (last visited July 19, 2025)
Share of respondents who identified as lesbian, gay, bisexual, transgender, or something other than heterosexual in the United States from 2012 to 2024, by generation [Graph], Gallup, February 20, 2025. [Online]. Available: https://www.statista.com/statistics/719685/american-adults-who-identify-as-homosexual-bisexual-transgender-by-generation/
Advertisement
Profit from additional features with an Employee Account
Please create an employee account to be able to mark statistics as favorites.
Then you can access your favorite statistics via the star in the header.
Profit from the additional features of your individual account
Currently, you are using a shared account. To use individual functions (e.g., mark statistics as favourites, set
statistic alerts) please log in with your personal account.
If you are an admin, please authenticate by logging in again.