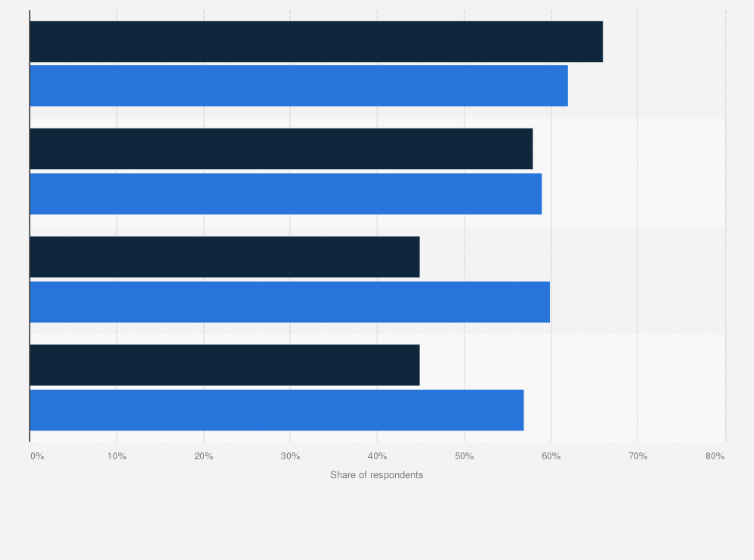
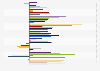
This statistic provides information on the share of consumers with an active food and beverage subscription in the United States as of February 2017, sorted by generation. According to the source, 66 percent of Generation X respondents reported having an active food and beverage subscription for individual foods and snack items.
Share of consumers with an active food and beverage subscription in the United States as of February 2017, by generation*
Adjust the presentation of the statistic and data points.
Share the statistic on social media channels or embed the statistic in your
website using "Embed Code", where available.
Cite this statistic and select one of the following formats: APA, Chicago, Harvard, MLA & Bluebook.
Print the statistic including description and metadata.
Chart type
Share of consumers with an active food and beverage subscription in the United States as of February 2017, by generation*
Share this statistic
You have no right to use this feature.
Make sure to contact us if you are interested in scientific citation.
You can upgrade your account to enable this functionality for all statistics.
This feature is not available with your current account.Request access
Consumers, who subscribe to food and non-alcoholic drink items per sub-group.
Method of interview
Online survey
Supplementary notes
* Refers to non-alcoholic drink items.
This question was phrased by the source as follows: "For which, if any, of the following do you have a subscription (i.e. that you pay for on a scheduled basis)?"
Learn more about how Statista can support your business.
Worldpay. (March 1, 2017). Share of consumers with an active food and beverage subscription in the United States as of February 2017, by generation* [Graph]. In Statista. Retrieved June 02, 2025, from https://www.statista.com/statistics/721366/active-food-beverage-subscriptions-by-generation/
Worldpay. "Share of consumers with an active food and beverage subscription in the United States as of February 2017, by generation*." Chart. March 1, 2017. Statista. Accessed June 02, 2025. https://www.statista.com/statistics/721366/active-food-beverage-subscriptions-by-generation/
Worldpay. (2017). Share of consumers with an active food and beverage subscription in the United States as of February 2017, by generation*. Statista. Statista Inc.. Accessed: June 02, 2025. https://www.statista.com/statistics/721366/active-food-beverage-subscriptions-by-generation/
Worldpay. "Share of Consumers with An Active Food and Beverage Subscription in The United States as of February 2017, by Generation*." Statista, Statista Inc., 1 Mar 2017, https://www.statista.com/statistics/721366/active-food-beverage-subscriptions-by-generation/
Worldpay, Share of consumers with an active food and beverage subscription in the United States as of February 2017, by generation* Statista, https://www.statista.com/statistics/721366/active-food-beverage-subscriptions-by-generation/ (last visited June 02, 2025)
Share of consumers with an active food and beverage subscription in the United States as of February 2017, by generation* [Graph], Worldpay, March 1, 2017. [Online]. Available: https://www.statista.com/statistics/721366/active-food-beverage-subscriptions-by-generation/
Profit from additional features with an Employee Account
Please create an employee account to be able to mark statistics as favorites.
Then you can access your favorite statistics via the star in the header.
Profit from the additional features of your individual account
Currently, you are using a shared account. To use individual functions (e.g., mark statistics as favourites, set
statistic alerts) please log in with your personal account.
If you are an admin, please authenticate by logging in again.