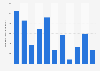
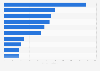
The graph shows the year-over-year dollar sales growth of food categories containing chia seeds in the United States in 2017. Dollar sales of powered instant drinks containing chia seeds increased by approximately *** percent compared to the previous year.
Profit from the additional features of your individual account
Currently, you are using a shared account. To use individual functions (e.g., mark statistics as favourites, set
statistic alerts) please log in with your personal account.
If you are an admin, please authenticate by logging in again.
Learn more about how Statista can support your business.
Nielsen. (April 24, 2017). Year-over-year dollar sales growth of food categories containing chia seeds in the United States in 2017 [Graph]. In Statista. Retrieved July 12, 2025, from https://www.statista.com/statistics/726659/dollar-growth-chia-seeds/
Nielsen. "Year-over-year dollar sales growth of food categories containing chia seeds in the United States in 2017." Chart. April 24, 2017. Statista. Accessed July 12, 2025. https://www.statista.com/statistics/726659/dollar-growth-chia-seeds/
Nielsen. (2017). Year-over-year dollar sales growth of food categories containing chia seeds in the United States in 2017. Statista. Statista Inc.. Accessed: July 12, 2025. https://www.statista.com/statistics/726659/dollar-growth-chia-seeds/
Nielsen. "Year-over-year Dollar Sales Growth of Food Categories Containing Chia Seeds in The United States in 2017." Statista, Statista Inc., 24 Apr 2017, https://www.statista.com/statistics/726659/dollar-growth-chia-seeds/
Nielsen, Year-over-year dollar sales growth of food categories containing chia seeds in the United States in 2017 Statista, https://www.statista.com/statistics/726659/dollar-growth-chia-seeds/ (last visited July 12, 2025)
Year-over-year dollar sales growth of food categories containing chia seeds in the United States in 2017 [Graph], Nielsen, April 24, 2017. [Online]. Available: https://www.statista.com/statistics/726659/dollar-growth-chia-seeds/