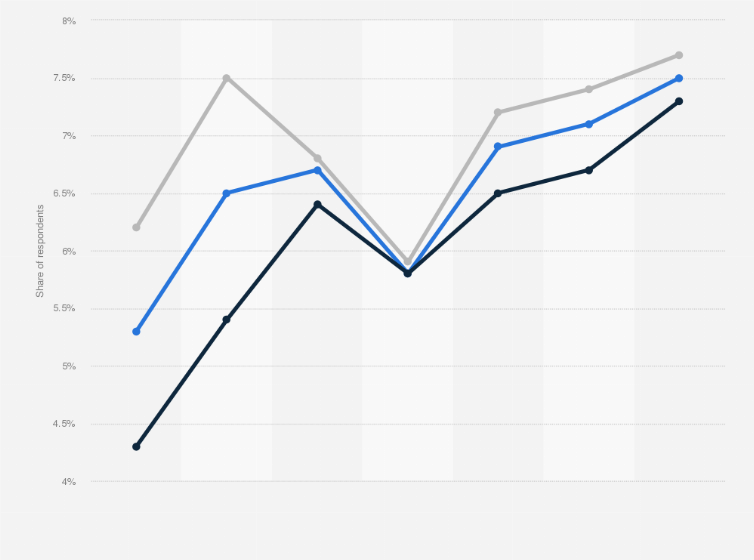
This statistic shows the results of a survey conducted between mid-2016 and mid-2017 among adult Americans who are interested in cable or satellite TV subscriptions on their preference for the Verizon Fios brand. The results were sorted by income. During the survey in May/June 2016, 4.3 percent of respondents with an income of less than 50,000 U.S. dollars stated they prefer Verizon Fios; 6.2 percent of respondents with an income of 50,000 U.S. dollars or more stated the same.
United States: Brand preferences for Verizon Fios from May/June 2016 through May/June 2017, by income
Adjust the presentation of the statistic and data points.
Share the statistic on social media channels or embed the statistic in your
website using "Embed Code", where available.
Cite this statistic and select one of the following formats: APA, Chicago, Harvard, MLA & Bluebook.
Print the statistic including description and metadata.
Chart type
United States: Brand preferences for Verizon Fios from May/June 2016 through May/June 2017, by income
Share this statistic
You have no right to use this feature.
Make sure to contact us if you are interested in scientific citation.
You can upgrade your account to enable this functionality for all statistics.
This feature is not available with your current account.Request access
Learn more about how Statista can support your business.
The Brand Strength Monitor. (July 20, 2017). United States: Brand preferences for Verizon Fios from May/June 2016 through May/June 2017, by income [Graph]. In Statista. Retrieved May 11, 2025, from https://www.statista.com/statistics/728088/us-brand-preferences-for-verizon-fios-by-income/
The Brand Strength Monitor. "United States: Brand preferences for Verizon Fios from May/June 2016 through May/June 2017, by income." Chart. July 20, 2017. Statista. Accessed May 11, 2025. https://www.statista.com/statistics/728088/us-brand-preferences-for-verizon-fios-by-income/
The Brand Strength Monitor. (2017). United States: Brand preferences for Verizon Fios from May/June 2016 through May/June 2017, by income. Statista. Statista Inc.. Accessed: May 11, 2025. https://www.statista.com/statistics/728088/us-brand-preferences-for-verizon-fios-by-income/
The Brand Strength Monitor. "United States: Brand Preferences for Verizon Fios from May/June 2016 through May/June 2017, by Income." Statista, Statista Inc., 20 Jul 2017, https://www.statista.com/statistics/728088/us-brand-preferences-for-verizon-fios-by-income/
The Brand Strength Monitor, United States: Brand preferences for Verizon Fios from May/June 2016 through May/June 2017, by income Statista, https://www.statista.com/statistics/728088/us-brand-preferences-for-verizon-fios-by-income/ (last visited May 11, 2025)
United States: Brand preferences for Verizon Fios from May/June 2016 through May/June 2017, by income [Graph], The Brand Strength Monitor, July 20, 2017. [Online]. Available: https://www.statista.com/statistics/728088/us-brand-preferences-for-verizon-fios-by-income/
Profit from additional features with an Employee Account
Please create an employee account to be able to mark statistics as favorites.
Then you can access your favorite statistics via the star in the header.
Profit from the additional features of your individual account
Currently, you are using a shared account. To use individual functions (e.g., mark statistics as favourites, set
statistic alerts) please log in with your personal account.
If you are an admin, please authenticate by logging in again.