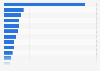
This statistic shows the age structure in St. Vincent and the Grenadines from 2013 to 2023. In 2023, about 21.65 percent of St. Vincent and the Grenadines' total population were aged 0 to 14 years.
Advertisement
Advertisement
St. Vincent and the Grenadines: Age structure from 2013 to 2023
Profit from the additional features of your individual account
Currently, you are using a shared account. To use individual functions (e.g., mark statistics as favourites, set
statistic alerts) please log in with your personal account.
If you are an admin, please authenticate by logging in again.
Learn more about how Statista can support your business.
World Bank. (January 28, 2025). St. Vincent and the Grenadines: Age structure from 2013 to 2023 [Graph]. In Statista. Retrieved June 26, 2025, from https://www.statista.com/statistics/731173/age-structure-in-st-vincent-and-the-grenadines/
World Bank. "St. Vincent and the Grenadines: Age structure from 2013 to 2023." Chart. January 28, 2025. Statista. Accessed June 26, 2025. https://www.statista.com/statistics/731173/age-structure-in-st-vincent-and-the-grenadines/
World Bank. (2025). St. Vincent and the Grenadines: Age structure from 2013 to 2023. Statista. Statista Inc.. Accessed: June 26, 2025. https://www.statista.com/statistics/731173/age-structure-in-st-vincent-and-the-grenadines/
World Bank. "St. Vincent and The Grenadines: Age Structure from 2013 to 2023." Statista, Statista Inc., 28 Jan 2025, https://www.statista.com/statistics/731173/age-structure-in-st-vincent-and-the-grenadines/
World Bank, St. Vincent and the Grenadines: Age structure from 2013 to 2023 Statista, https://www.statista.com/statistics/731173/age-structure-in-st-vincent-and-the-grenadines/ (last visited June 26, 2025)
St. Vincent and the Grenadines: Age structure from 2013 to 2023 [Graph], World Bank, January 28, 2025. [Online]. Available: https://www.statista.com/statistics/731173/age-structure-in-st-vincent-and-the-grenadines/