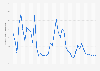
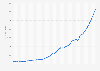
Since 2000, Russia has consistently had the lowest population growth rate of the BRICS countries, and it even experienced a population decline throughout most of the 2000s, and again in the late 2010s. For Brazil, China, and India, population growth has gradually fallen over time, as their demographic development progresses. South Africa has had the highest population growth rate since 2010, as its population recovered from the initial impact of the HIV/AIDS pandemic, before it started falling as birth rates fall more in line with death rates.
Advertisement
Advertisement
BRICS countries: Population growth from 2000 to 2023
(compared to previous year)
Profit from the additional features of your individual account
Currently, you are using a shared account. To use individual functions (e.g., mark statistics as favourites, set
statistic alerts) please log in with your personal account.
If you are an admin, please authenticate by logging in again.
Learn more about how Statista can support your business.
World Bank. (January 28, 2025). BRICS countries: Population growth from 2000 to 2023 (compared to previous year) [Graph]. In Statista. Retrieved June 27, 2025, from https://www.statista.com/statistics/741671/population-growth-in-the-bric-countries/
World Bank. "BRICS countries: Population growth from 2000 to 2023 (compared to previous year)." Chart. January 28, 2025. Statista. Accessed June 27, 2025. https://www.statista.com/statistics/741671/population-growth-in-the-bric-countries/
World Bank. (2025). BRICS countries: Population growth from 2000 to 2023 (compared to previous year). Statista. Statista Inc.. Accessed: June 27, 2025. https://www.statista.com/statistics/741671/population-growth-in-the-bric-countries/
World Bank. "Brics Countries: Population Growth from 2000 to 2023 (Compared to Previous Year)." Statista, Statista Inc., 28 Jan 2025, https://www.statista.com/statistics/741671/population-growth-in-the-bric-countries/
World Bank, BRICS countries: Population growth from 2000 to 2023 (compared to previous year) Statista, https://www.statista.com/statistics/741671/population-growth-in-the-bric-countries/ (last visited June 27, 2025)
BRICS countries: Population growth from 2000 to 2023 (compared to previous year) [Graph], World Bank, January 28, 2025. [Online]. Available: https://www.statista.com/statistics/741671/population-growth-in-the-bric-countries/