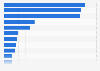
South Korea accounted for 11 percent of cumulative LNG imports from the United States between February 2016 and October 2024. This made it the leading destination for U.S. LNG exports by cumulative volume. Most of the leading destinations were East Asian or European countries.
Distribution of cumulative liquefied natural gas exports from the United States between February 2016 and October 2024, by destination
Figures correspond to the total U.S. LNG exports by vessel during the stated period of 21,515.3 billion cubic feet of natural gas. Split cargos counted as individual cargos and countries.
Profit from the additional features of your individual account
Currently, you are using a shared account. To use individual functions (e.g., mark statistics as favourites, set
statistic alerts) please log in with your personal account.
If you are an admin, please authenticate by logging in again.
Learn more about how Statista can support your business.
US Department of Energy. (December 19, 2024). Distribution of cumulative liquefied natural gas exports from the United States between February 2016 and October 2024, by destination [Graph]. In Statista. Retrieved June 07, 2025, from https://www.statista.com/statistics/742095/united-states-lng-export-distribution-by-importing-country/
US Department of Energy. "Distribution of cumulative liquefied natural gas exports from the United States between February 2016 and October 2024, by destination." Chart. December 19, 2024. Statista. Accessed June 07, 2025. https://www.statista.com/statistics/742095/united-states-lng-export-distribution-by-importing-country/
US Department of Energy. (2024). Distribution of cumulative liquefied natural gas exports from the United States between February 2016 and October 2024, by destination. Statista. Statista Inc.. Accessed: June 07, 2025. https://www.statista.com/statistics/742095/united-states-lng-export-distribution-by-importing-country/
US Department of Energy. "Distribution of Cumulative Liquefied Natural Gas Exports from The United States between February 2016 and October 2024, by Destination." Statista, Statista Inc., 19 Dec 2024, https://www.statista.com/statistics/742095/united-states-lng-export-distribution-by-importing-country/
US Department of Energy, Distribution of cumulative liquefied natural gas exports from the United States between February 2016 and October 2024, by destination Statista, https://www.statista.com/statistics/742095/united-states-lng-export-distribution-by-importing-country/ (last visited June 07, 2025)
Distribution of cumulative liquefied natural gas exports from the United States between February 2016 and October 2024, by destination [Graph], US Department of Energy, December 19, 2024. [Online]. Available: https://www.statista.com/statistics/742095/united-states-lng-export-distribution-by-importing-country/