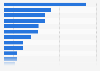
In 2023, the vast majority of dentists in France were self-employed. Out of the 44,400 practicing doctors recorded in the country that year, 37,600 were self-employed, while 6,800 were employed either in hospitals or other establishments.
Advertisement
Advertisement
Number of dentists in France in 2023, by type of employment
Profit from the additional features of your individual account
Currently, you are using a shared account. To use individual functions (e.g., mark statistics as favourites, set
statistic alerts) please log in with your personal account.
If you are an admin, please authenticate by logging in again.
Learn more about how Statista can support your business.
DREES. (November 21, 2024). Number of dentists in France in 2023, by type of employment [Graph]. In Statista. Retrieved June 26, 2025, from https://www.statista.com/statistics/746785/number-dentists-employment-type-france/
DREES. "Number of dentists in France in 2023, by type of employment." Chart. November 21, 2024. Statista. Accessed June 26, 2025. https://www.statista.com/statistics/746785/number-dentists-employment-type-france/
DREES. (2024). Number of dentists in France in 2023, by type of employment. Statista. Statista Inc.. Accessed: June 26, 2025. https://www.statista.com/statistics/746785/number-dentists-employment-type-france/
DREES. "Number of Dentists in France in 2023, by Type of Employment." Statista, Statista Inc., 21 Nov 2024, https://www.statista.com/statistics/746785/number-dentists-employment-type-france/
DREES, Number of dentists in France in 2023, by type of employment Statista, https://www.statista.com/statistics/746785/number-dentists-employment-type-france/ (last visited June 26, 2025)
Number of dentists in France in 2023, by type of employment [Graph], DREES, November 21, 2024. [Online]. Available: https://www.statista.com/statistics/746785/number-dentists-employment-type-france/