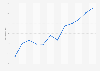
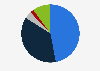
In 2022, the sales volume of processed fruit and vegetables in the Indian packaged foods market amounted to 138 thousand metric tons. Edible oils and dairy products represented the largest portion of the packaged food segment in the country that year.
Advertisement
Advertisement
Sales volume of processed fruit and vegetables in India from 2012 to 2022
(in 1,000 metric tons)
Profit from the additional features of your individual account
Currently, you are using a shared account. To use individual functions (e.g., mark statistics as favourites, set
statistic alerts) please log in with your personal account.
If you are an admin, please authenticate by logging in again.
Learn more about how Statista can support your business.
USDA Foreign Agricultural Service. (April 4, 2023). Sales volume of processed fruit and vegetables in India from 2012 to 2022 (in 1,000 metric tons) [Graph]. In Statista. Retrieved July 07, 2025, from https://www.statista.com/statistics/747574/processed-fruit-and-vegetables-sales-volume-india/
USDA Foreign Agricultural Service. "Sales volume of processed fruit and vegetables in India from 2012 to 2022 (in 1,000 metric tons)." Chart. April 4, 2023. Statista. Accessed July 07, 2025. https://www.statista.com/statistics/747574/processed-fruit-and-vegetables-sales-volume-india/
USDA Foreign Agricultural Service. (2023). Sales volume of processed fruit and vegetables in India from 2012 to 2022 (in 1,000 metric tons). Statista. Statista Inc.. Accessed: July 07, 2025. https://www.statista.com/statistics/747574/processed-fruit-and-vegetables-sales-volume-india/
USDA Foreign Agricultural Service. "Sales Volume of Processed Fruit and Vegetables in India from 2012 to 2022 (in 1,000 Metric Tons)." Statista, Statista Inc., 4 Apr 2023, https://www.statista.com/statistics/747574/processed-fruit-and-vegetables-sales-volume-india/
USDA Foreign Agricultural Service, Sales volume of processed fruit and vegetables in India from 2012 to 2022 (in 1,000 metric tons) Statista, https://www.statista.com/statistics/747574/processed-fruit-and-vegetables-sales-volume-india/ (last visited July 07, 2025)
Sales volume of processed fruit and vegetables in India from 2012 to 2022 (in 1,000 metric tons) [Graph], USDA Foreign Agricultural Service, April 4, 2023. [Online]. Available: https://www.statista.com/statistics/747574/processed-fruit-and-vegetables-sales-volume-india/