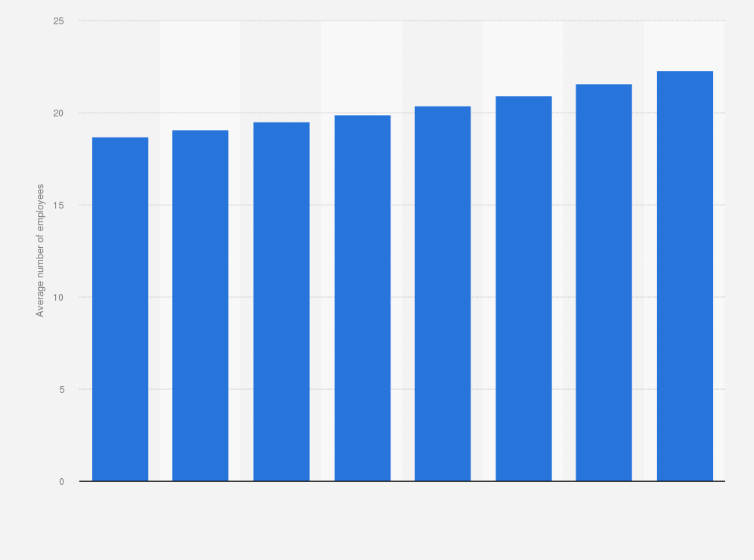
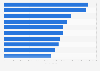
As the number of companies employing workers in the Belgian food and beverage sector decreased, the number of employees per company rose steadily from 2012 onwards. In 2012, there were roughly 19 employees per company within the Belgian food and beverage sector, whereas by 2019 this figure had increased to 22 employees per company.
Advertisement
Advertisement
Average number of employees of companies in the food industry in Belgium from 2012 to 2019
Adjust the presentation of the statistic and data points.
Share the statistic on social media channels or embed the statistic in your
website using "Embed Code", where available.
Cite this statistic and select one of the following formats: APA, Chicago, Harvard, MLA & Bluebook.
Print the statistic including description and metadata.
Chart type
Average number of employees of companies in the food industry in Belgium from 2012 to 2019
Share this statistic
You have no right to use this feature.
Make sure to contact us if you are interested in scientific citation.
You can upgrade your account to enable this functionality for all statistics.
This feature is not available with your current account.Request access
Learn more about how Statista can support your business.
FEVIA. (June 12, 2020). Average number of employees of companies in the food industry in Belgium from 2012 to 2019 [Graph]. In Statista. Retrieved July 06, 2025, from https://www.statista.com/statistics/749280/average-number-of-employees-of-food-companies-in-belgium/
FEVIA. "Average number of employees of companies in the food industry in Belgium from 2012 to 2019." Chart. June 12, 2020. Statista. Accessed July 06, 2025. https://www.statista.com/statistics/749280/average-number-of-employees-of-food-companies-in-belgium/
FEVIA. (2020). Average number of employees of companies in the food industry in Belgium from 2012 to 2019. Statista. Statista Inc.. Accessed: July 06, 2025. https://www.statista.com/statistics/749280/average-number-of-employees-of-food-companies-in-belgium/
FEVIA. "Average Number of Employees of Companies in The Food Industry in Belgium from 2012 to 2019." Statista, Statista Inc., 12 Jun 2020, https://www.statista.com/statistics/749280/average-number-of-employees-of-food-companies-in-belgium/
FEVIA, Average number of employees of companies in the food industry in Belgium from 2012 to 2019 Statista, https://www.statista.com/statistics/749280/average-number-of-employees-of-food-companies-in-belgium/ (last visited July 06, 2025)
Average number of employees of companies in the food industry in Belgium from 2012 to 2019 [Graph], FEVIA, June 12, 2020. [Online]. Available: https://www.statista.com/statistics/749280/average-number-of-employees-of-food-companies-in-belgium/
Advertisement
Profit from additional features with an Employee Account
Please create an employee account to be able to mark statistics as favorites.
Then you can access your favorite statistics via the star in the header.
Profit from the additional features of your individual account
Currently, you are using a shared account. To use individual functions (e.g., mark statistics as favourites, set
statistic alerts) please log in with your personal account.
If you are an admin, please authenticate by logging in again.