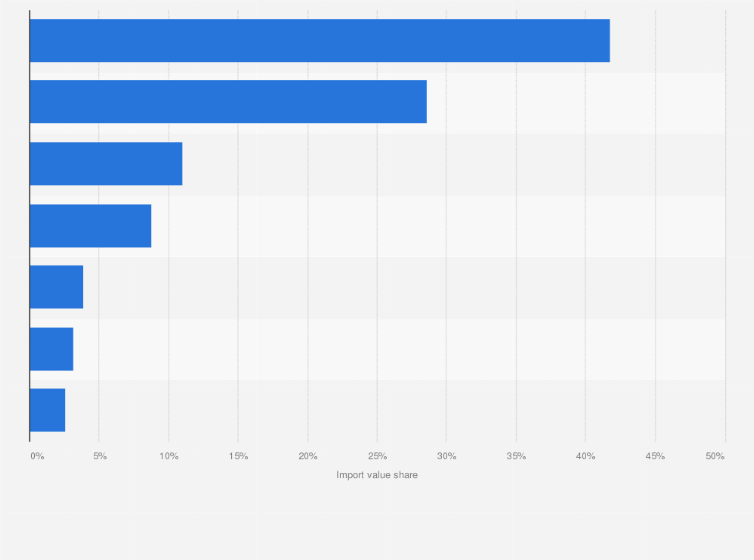
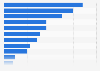
In the financial year 2024, processed fruit that were imported into Australia accounted for around 41.8 percent of the total horticulture product import value. Processed vegetables followed with a 28.6 percent share of the total horticultural product imports.
Advertisement
Advertisement
Distribution of the import value of leading horticulture products in Australia in financial year 2024, by product group
Adjust the presentation of the statistic and data points.
Share the statistic on social media channels or embed the statistic in your
website using "Embed Code", where available.
Cite this statistic and select one of the following formats: APA, Chicago, Harvard, MLA & Bluebook.
Print the statistic including description and metadata.
Chart type
Distribution of the import value of leading horticulture products in Australia in financial year 2024, by product group
Share this statistic
You have no right to use this feature.
Make sure to contact us if you are interested in scientific citation.
You can upgrade your account to enable this functionality for all statistics.
This feature is not available with your current account.Request access
Learn more about how Statista can support your business.
Hort Innovation. (February 19, 2025). Distribution of the import value of leading horticulture products in Australia in financial year 2024, by product group [Graph]. In Statista. Retrieved June 13, 2025, from https://www.statista.com/statistics/750945/australia-horticulture-import-value-distribution-by-group/
Hort Innovation. "Distribution of the import value of leading horticulture products in Australia in financial year 2024, by product group." Chart. February 19, 2025. Statista. Accessed June 13, 2025. https://www.statista.com/statistics/750945/australia-horticulture-import-value-distribution-by-group/
Hort Innovation. (2025). Distribution of the import value of leading horticulture products in Australia in financial year 2024, by product group. Statista. Statista Inc.. Accessed: June 13, 2025. https://www.statista.com/statistics/750945/australia-horticulture-import-value-distribution-by-group/
Hort Innovation. "Distribution of The Import Value of Leading Horticulture Products in Australia in Financial Year 2024, by Product Group." Statista, Statista Inc., 19 Feb 2025, https://www.statista.com/statistics/750945/australia-horticulture-import-value-distribution-by-group/
Hort Innovation, Distribution of the import value of leading horticulture products in Australia in financial year 2024, by product group Statista, https://www.statista.com/statistics/750945/australia-horticulture-import-value-distribution-by-group/ (last visited June 13, 2025)
Distribution of the import value of leading horticulture products in Australia in financial year 2024, by product group [Graph], Hort Innovation, February 19, 2025. [Online]. Available: https://www.statista.com/statistics/750945/australia-horticulture-import-value-distribution-by-group/
Advertisement
Profit from additional features with an Employee Account
Please create an employee account to be able to mark statistics as favorites.
Then you can access your favorite statistics via the star in the header.
Profit from the additional features of your individual account
Currently, you are using a shared account. To use individual functions (e.g., mark statistics as favourites, set
statistic alerts) please log in with your personal account.
If you are an admin, please authenticate by logging in again.