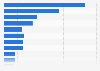
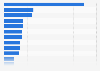
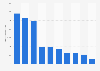
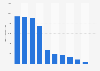
This chart shows the average annual value change in the consumption of food products and beverages in France from 2008 to 2013. The change rate of fish and seafood has been less than one percent.
Advertisement
Advertisement
Average annual value change in the consumption of food products and beverages in France from 2008 to 2013
The source adds the following information: "The changes are calculated according to the individual consumption of the French. The raw data in the National Accounts are adjusted for demographic change."
Profit from the additional features of your individual account
Currently, you are using a shared account. To use individual functions (e.g., mark statistics as favourites, set
statistic alerts) please log in with your personal account.
If you are an admin, please authenticate by logging in again.
Learn more about how Statista can support your business.
FranceAgriMer, & Insee. (September 1, 2014). Average annual value change in the consumption of food products and beverages in France from 2008 to 2013 [Graph]. In Statista. Retrieved June 17, 2025, from https://www.statista.com/statistics/766757/food-and-beverages-annual-value-change-in-consumption-in-france/
FranceAgriMer, und Insee. "Average annual value change in the consumption of food products and beverages in France from 2008 to 2013." Chart. September 1, 2014. Statista. Accessed June 17, 2025. https://www.statista.com/statistics/766757/food-and-beverages-annual-value-change-in-consumption-in-france/
FranceAgriMer, Insee. (2014). Average annual value change in the consumption of food products and beverages in France from 2008 to 2013. Statista. Statista Inc.. Accessed: June 17, 2025. https://www.statista.com/statistics/766757/food-and-beverages-annual-value-change-in-consumption-in-france/
FranceAgriMer, and Insee. "Average Annual Value Change in The Consumption of Food Products and Beverages in France from 2008 to 2013." Statista, Statista Inc., 1 Sep 2014, https://www.statista.com/statistics/766757/food-and-beverages-annual-value-change-in-consumption-in-france/
FranceAgriMer & Insee, Average annual value change in the consumption of food products and beverages in France from 2008 to 2013 Statista, https://www.statista.com/statistics/766757/food-and-beverages-annual-value-change-in-consumption-in-france/ (last visited June 17, 2025)
Average annual value change in the consumption of food products and beverages in France from 2008 to 2013 [Graph], FranceAgriMer, & Insee, September 1, 2014. [Online]. Available: https://www.statista.com/statistics/766757/food-and-beverages-annual-value-change-in-consumption-in-france/