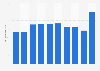
The gross savings in Malaysia decreased by 13.3 billion U.S. dollars (-12.17 percent) in 2023 in comparison to the previous year. Nevertheless, the last two years recorded significantly higher gross savings than the preceding years. Gross savings are calculated as gross national income minus total consumption plus net transfers. Data are in current U.S. dollars.
Profit from the additional features of your individual account
Currently, you are using a shared account. To use individual functions (e.g., mark statistics as favourites, set
statistic alerts) please log in with your personal account.
If you are an admin, please authenticate by logging in again.
Learn more about how Statista can support your business.
World Bank. (March 24, 2025). Gross savings in Malaysia from 2008 to 2023 (in billion U.S. dollars) [Graph]. In Statista. Retrieved June 27, 2025, from https://www.statista.com/statistics/779586/gross-savings-malaysia/
World Bank. "Gross savings in Malaysia from 2008 to 2023 (in billion U.S. dollars)." Chart. March 24, 2025. Statista. Accessed June 27, 2025. https://www.statista.com/statistics/779586/gross-savings-malaysia/
World Bank. (2025). Gross savings in Malaysia from 2008 to 2023 (in billion U.S. dollars). Statista. Statista Inc.. Accessed: June 27, 2025. https://www.statista.com/statistics/779586/gross-savings-malaysia/
World Bank. "Gross Savings in Malaysia from 2008 to 2023 (in Billion U.S. Dollars)." Statista, Statista Inc., 24 Mar 2025, https://www.statista.com/statistics/779586/gross-savings-malaysia/
World Bank, Gross savings in Malaysia from 2008 to 2023 (in billion U.S. dollars) Statista, https://www.statista.com/statistics/779586/gross-savings-malaysia/ (last visited June 27, 2025)
Gross savings in Malaysia from 2008 to 2023 (in billion U.S. dollars) [Graph], World Bank, March 24, 2025. [Online]. Available: https://www.statista.com/statistics/779586/gross-savings-malaysia/