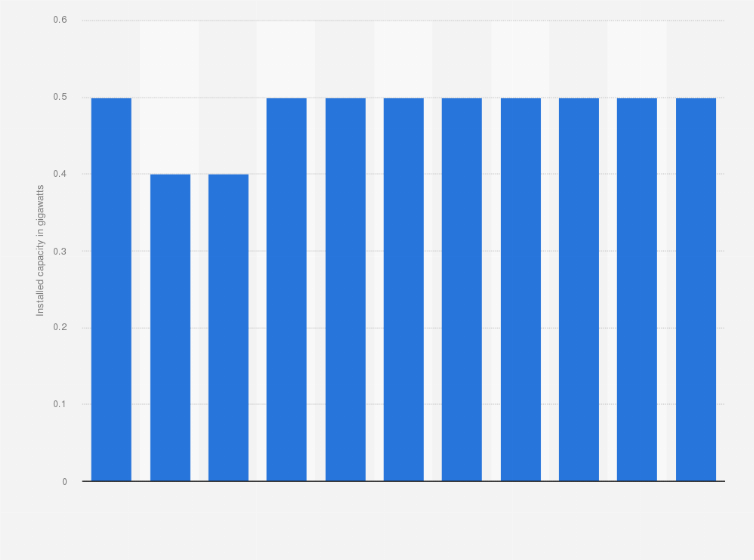
Nuclear capacity has seen little change in the Netherlands since 1995. Figures oscillated between 0.4 and 05 gigawatts of installed capacity, amounting to 0.5 gigawatts since 2014, up from 0.4 gigawatts in 2000.
Advertisement
Advertisement
Installed nuclear capacity in the Netherlands from 1995 to 2019
(in gigawatts)
Adjust the presentation of the statistic and data points.
Share the statistic on social media channels or embed the statistic in your
website using "Embed Code", where available.
Cite this statistic and select one of the following formats: APA, Chicago, Harvard, MLA & Bluebook.
Print the statistic including description and metadata.
Chart type
Installed nuclear capacity in the Netherlands from 1995 to 2019
Share this statistic
You have no right to use this feature.
Make sure to contact us if you are interested in scientific citation.
You can upgrade your account to enable this functionality for all statistics.
This feature is not available with your current account.Request access
Learn more about how Statista can support your business.
Publications Office of the European Union. (September 28, 2021). Installed nuclear capacity in the Netherlands from 1995 to 2019 (in gigawatts) [Graph]. In Statista. Retrieved June 26, 2025, from https://www.statista.com/statistics/783705/installed-nuclear-capacity-in-the-netherlands/
Publications Office of the European Union. "Installed nuclear capacity in the Netherlands from 1995 to 2019 (in gigawatts)." Chart. September 28, 2021. Statista. Accessed June 26, 2025. https://www.statista.com/statistics/783705/installed-nuclear-capacity-in-the-netherlands/
Publications Office of the European Union. (2021). Installed nuclear capacity in the Netherlands from 1995 to 2019 (in gigawatts). Statista. Statista Inc.. Accessed: June 26, 2025. https://www.statista.com/statistics/783705/installed-nuclear-capacity-in-the-netherlands/
Publications Office of the European Union. "Installed Nuclear Capacity in The Netherlands from 1995 to 2019 (in Gigawatts)." Statista, Statista Inc., 28 Sep 2021, https://www.statista.com/statistics/783705/installed-nuclear-capacity-in-the-netherlands/
Publications Office of the European Union, Installed nuclear capacity in the Netherlands from 1995 to 2019 (in gigawatts) Statista, https://www.statista.com/statistics/783705/installed-nuclear-capacity-in-the-netherlands/ (last visited June 26, 2025)
Installed nuclear capacity in the Netherlands from 1995 to 2019 (in gigawatts) [Graph], Publications Office of the European Union, September 28, 2021. [Online]. Available: https://www.statista.com/statistics/783705/installed-nuclear-capacity-in-the-netherlands/
Advertisement
Profit from additional features with an Employee Account
Please create an employee account to be able to mark statistics as favorites.
Then you can access your favorite statistics via the star in the header.
Profit from the additional features of your individual account
Currently, you are using a shared account. To use individual functions (e.g., mark statistics as favourites, set
statistic alerts) please log in with your personal account.
If you are an admin, please authenticate by logging in again.