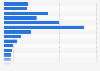
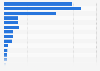
In the year 1991, the rate of reported cases of chlamydia in Canada was 170.17 per 100,000 people. This rate had increased to around 323 by the year 2023. This statistic shows the rate of reported cases of chlamydia in Canada from 1991 to 2023, per 100,000 population.
Advertisement
Advertisement
Rate of reported cases of chlamydia in Canada from 1991 to 2023
(per 100,000 population)
Characteristic
Number of cases per 100,000 population
1991
170.17
1992
169.74
1993
158.59
1994
150.12
1995
137.32
1996
117.3
1997
116.74
1998
130.56
1999
137.95
2000
149.39
2001
161.1
2002
179.15
2003
189.71
0255075100125150175200225250275300325350375400425
Add this content to your personal favorites. These can be accessed from the favorites menu in the main navigation.
You have no right to use this feature.
Make sure to contact us if you are interested in scientific citation.
You can upgrade your account to enable this functionality for all statistics.
This feature is not available with your current account.Request access
Learn more about how Statista can support your business.
Government of Canada. (June 11, 2025). Rate of reported cases of chlamydia in Canada from 1991 to 2023 (per 100,000 population) [Graph]. In Statista. Retrieved July 26, 2025, from https://www.statista.com/statistics/786270/chlamydia-reported-cases-rate-in-canada/
Government of Canada. "Rate of reported cases of chlamydia in Canada from 1991 to 2023 (per 100,000 population)." Chart. June 11, 2025. Statista. Accessed July 26, 2025. https://www.statista.com/statistics/786270/chlamydia-reported-cases-rate-in-canada/
Government of Canada. (2025). Rate of reported cases of chlamydia in Canada from 1991 to 2023 (per 100,000 population). Statista. Statista Inc.. Accessed: July 26, 2025. https://www.statista.com/statistics/786270/chlamydia-reported-cases-rate-in-canada/
Government of Canada. "Rate of Reported Cases of Chlamydia in Canada from 1991 to 2023 (per 100,000 Population)." Statista, Statista Inc., 11 Jun 2025, https://www.statista.com/statistics/786270/chlamydia-reported-cases-rate-in-canada/
Government of Canada, Rate of reported cases of chlamydia in Canada from 1991 to 2023 (per 100,000 population) Statista, https://www.statista.com/statistics/786270/chlamydia-reported-cases-rate-in-canada/ (last visited July 26, 2025)
Rate of reported cases of chlamydia in Canada from 1991 to 2023 (per 100,000 population) [Graph], Government of Canada, June 11, 2025. [Online]. Available: https://www.statista.com/statistics/786270/chlamydia-reported-cases-rate-in-canada/
Advertisement
Profit from additional features with an Employee Account
Please create an employee account to be able to mark statistics as favorites.
Then you can access your favorite statistics via the star in the header.
Profit from the additional features of your individual account
Currently, you are using a shared account. To use individual functions (e.g., mark statistics as favourites, set
statistic alerts) please log in with your personal account.
If you are an admin, please authenticate by logging in again.