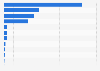
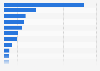
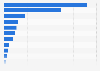
The statistic shows the annual revenue of Everi Holdings from 2014 to 2019, broken down by segment. In 2019, the slot machine vendor and casino solutions provider generated approximately 283.12 million U.S. dollars from its games segment.
Advertisement
Advertisement
Revenue of Everi Holdings from 2014 to 2019, by segment
(in million U.S. dollars)
Characteristic
Games
Payments
FinTech
2019
283.12
-
250.11
2018
258.98
-
210.54
2017
222.78
752.17
-
2016
213.25
646.2
-
2015
214.42
612.58
-
2014
7.41
585.65
-
02505007501,0001,250
Add this content to your personal favorites. These can be accessed from the favorites menu in the main navigation.
You have no right to use this feature.
Make sure to contact us if you are interested in scientific citation.
You can upgrade your account to enable this functionality for all statistics.
This feature is not available with your current account.Request access
Learn more about how Statista can support your business.
Everi. (March 2, 2020). Revenue of Everi Holdings from 2014 to 2019, by segment (in million U.S. dollars) [Graph]. In Statista. Retrieved June 24, 2025, from https://www.statista.com/statistics/788051/everi-segment-revenue/
Everi. "Revenue of Everi Holdings from 2014 to 2019, by segment (in million U.S. dollars)." Chart. March 2, 2020. Statista. Accessed June 24, 2025. https://www.statista.com/statistics/788051/everi-segment-revenue/
Everi. (2020). Revenue of Everi Holdings from 2014 to 2019, by segment (in million U.S. dollars). Statista. Statista Inc.. Accessed: June 24, 2025. https://www.statista.com/statistics/788051/everi-segment-revenue/
Everi. "Revenue of Everi Holdings from 2014 to 2019, by Segment (in Million U.S. Dollars)." Statista, Statista Inc., 2 Mar 2020, https://www.statista.com/statistics/788051/everi-segment-revenue/
Everi, Revenue of Everi Holdings from 2014 to 2019, by segment (in million U.S. dollars) Statista, https://www.statista.com/statistics/788051/everi-segment-revenue/ (last visited June 24, 2025)
Revenue of Everi Holdings from 2014 to 2019, by segment (in million U.S. dollars) [Graph], Everi, March 2, 2020. [Online]. Available: https://www.statista.com/statistics/788051/everi-segment-revenue/
Advertisement
Profit from additional features with an Employee Account
Please create an employee account to be able to mark statistics as favorites.
Then you can access your favorite statistics via the star in the header.
Profit from the additional features of your individual account
Currently, you are using a shared account. To use individual functions (e.g., mark statistics as favourites, set
statistic alerts) please log in with your personal account.
If you are an admin, please authenticate by logging in again.