Data refers to fruit juices (including grape must) and vegetables juices, unfermented, not containing added spirit; whether or not containing added sugar or other sweetening matter.
The source does not specify the date of publication. The release date given is the date of access.
Profit from the additional features of your individual account
Currently, you are using a shared account. To use individual functions (e.g., mark statistics as favourites, set
statistic alerts) please log in with your personal account.
If you are an admin, please authenticate by logging in again.
Learn more about how Statista can support your business.
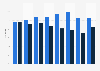
UN Comtrade. (September 26, 2023). Imports of fruit juice to Mexico from 2012 to 2022 (in million U.S. dollars) [Graph]. In Statista. Retrieved June 28, 2025, from https://www.statista.com/statistics/799020/fruit-juice-import-value-mexico/
UN Comtrade. "Imports of fruit juice to Mexico from 2012 to 2022 (in million U.S. dollars)." Chart. September 26, 2023. Statista. Accessed June 28, 2025. https://www.statista.com/statistics/799020/fruit-juice-import-value-mexico/
UN Comtrade. (2023). Imports of fruit juice to Mexico from 2012 to 2022 (in million U.S. dollars). Statista. Statista Inc.. Accessed: June 28, 2025. https://www.statista.com/statistics/799020/fruit-juice-import-value-mexico/
UN Comtrade. "Imports of Fruit Juice to Mexico from 2012 to 2022 (in Million U.S. Dollars)." Statista, Statista Inc., 26 Sep 2023, https://www.statista.com/statistics/799020/fruit-juice-import-value-mexico/
UN Comtrade, Imports of fruit juice to Mexico from 2012 to 2022 (in million U.S. dollars) Statista, https://www.statista.com/statistics/799020/fruit-juice-import-value-mexico/ (last visited June 28, 2025)
Imports of fruit juice to Mexico from 2012 to 2022 (in million U.S. dollars) [Graph], UN Comtrade, September 26, 2023. [Online]. Available: https://www.statista.com/statistics/799020/fruit-juice-import-value-mexico/