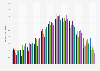
This statistic displays the average monthly rainfall in Portugal over the past 20 years. It shows that over the past twenty years the month with the highest average rainfall has been January, with an average rainfall of 171.5 mm. On average, August has been the driest month.
Advertisement
Advertisement
Average monthly rainfall in Portugal as of 2017*
(in millimeters)
Profit from the additional features of your individual account
Currently, you are using a shared account. To use individual functions (e.g., mark statistics as favourites, set
statistic alerts) please log in with your personal account.
If you are an admin, please authenticate by logging in again.
Learn more about how Statista can support your business.
GEO. (January 31, 2018). Average monthly rainfall in Portugal as of 2017* (in millimeters) [Graph]. In Statista. Retrieved June 21, 2025, from https://www.statista.com/statistics/802732/average-monthly-rainfall-portugal/
GEO. "Average monthly rainfall in Portugal as of 2017* (in millimeters) ." Chart. January 31, 2018. Statista. Accessed June 21, 2025. https://www.statista.com/statistics/802732/average-monthly-rainfall-portugal/
GEO. (2018). Average monthly rainfall in Portugal as of 2017* (in millimeters) . Statista. Statista Inc.. Accessed: June 21, 2025. https://www.statista.com/statistics/802732/average-monthly-rainfall-portugal/
GEO. "Average Monthly Rainfall in Portugal as of 2017* (in Millimeters) ." Statista, Statista Inc., 31 Jan 2018, https://www.statista.com/statistics/802732/average-monthly-rainfall-portugal/
GEO, Average monthly rainfall in Portugal as of 2017* (in millimeters) Statista, https://www.statista.com/statistics/802732/average-monthly-rainfall-portugal/ (last visited June 21, 2025)
Average monthly rainfall in Portugal as of 2017* (in millimeters) [Graph], GEO, January 31, 2018. [Online]. Available: https://www.statista.com/statistics/802732/average-monthly-rainfall-portugal/