In March 2025, United States furniture and home furnishing store sales were estimated to amount to approximately 11.6 billion U.S. dollars, a slight increase from the month before where the sales stood at around 10.4 billion.
How do U.S. consumers shop for furniture?
Upon being surveyed in 2024, one fifth of U.S. consumers shared that they would spend at least 500 U.S. dollars on furniture purchases, while around 15 percent said they would even go beyond 2,500 U.S. dollars. A somewhat important factor that American shoppers consider is the furniture’s brand, with nearly 30 percent sharing that sentiment in a different survey.
Key players on the U.S. furniture market
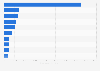
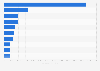
In terms of retail sales, Wayfair, Williams-Sonoma and IKEA are market leaders in the United States. Out of the three retailers, e-commerce giant Wayfair generated the highest sales, reaching approximately 10.47 billion U.S. dollars. During the last reported fiscal period in 2024, Wayfair had approximately 21 million active customers.
Figures are not adjusted for price changes. Retail and food services total and other subsector totals may include data for kinds of business not shown. Additional information on sample design, estimation procedures, and measures of sampling variability can be found here.
Profit from the additional features of your individual account
Currently, you are using a shared account. To use individual functions (e.g., mark statistics as favourites, set
statistic alerts) please log in with your personal account.
If you are an admin, please authenticate by logging in again.
Learn more about how Statista can support your business.
US Census Bureau. (May 15, 2025). Monthly retail sales of furniture and home furnishing stores in the United States from January 2017 to March 2025 (in million U.S. dollars) [Graph]. In Statista. Retrieved June 20, 2025, from https://www.statista.com/statistics/805086/furniture-and-home-furnishing-store-sales-us-by-month/
US Census Bureau. "Monthly retail sales of furniture and home furnishing stores in the United States from January 2017 to March 2025 (in million U.S. dollars)." Chart. May 15, 2025. Statista. Accessed June 20, 2025. https://www.statista.com/statistics/805086/furniture-and-home-furnishing-store-sales-us-by-month/
US Census Bureau. (2025). Monthly retail sales of furniture and home furnishing stores in the United States from January 2017 to March 2025 (in million U.S. dollars). Statista. Statista Inc.. Accessed: June 20, 2025. https://www.statista.com/statistics/805086/furniture-and-home-furnishing-store-sales-us-by-month/
US Census Bureau. "Monthly Retail Sales of Furniture and Home Furnishing Stores in The United States from January 2017 to March 2025 (in Million U.S. Dollars)." Statista, Statista Inc., 15 May 2025, https://www.statista.com/statistics/805086/furniture-and-home-furnishing-store-sales-us-by-month/
US Census Bureau, Monthly retail sales of furniture and home furnishing stores in the United States from January 2017 to March 2025 (in million U.S. dollars) Statista, https://www.statista.com/statistics/805086/furniture-and-home-furnishing-store-sales-us-by-month/ (last visited June 20, 2025)
Monthly retail sales of furniture and home furnishing stores in the United States from January 2017 to March 2025 (in million U.S. dollars) [Graph], US Census Bureau, May 15, 2025. [Online]. Available: https://www.statista.com/statistics/805086/furniture-and-home-furnishing-store-sales-us-by-month/