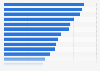
This statistic presents the percentage of people in the U.S. who injected drugs and who were HIV negative, but engaged in behaviors associated with HIV infection in the past 12 months as of 2018. During that year, 26 percent of people who injected drugs and were HIV-negative practiced receptive syringe sharing.
Percentage of people in the U.S. who injected drugs and who were HIV-negative, but engaged in select behaviors in the past year as of 2018
Adjust the presentation of the statistic and data points.
Share the statistic on social media channels or embed the statistic in your
website using "Embed Code", where available.
Cite this statistic and select one of the following formats: APA, Chicago, Harvard, MLA & Bluebook.
Print the statistic including description and metadata.
Chart type
Percentage of people in the U.S. who injected drugs and who were HIV-negative, but engaged in select behaviors in the past year as of 2018
Share this statistic
You have no right to use this feature.
Make sure to contact us if you are interested in scientific citation.
You can upgrade your account to enable this functionality for all statistics.
This feature is not available with your current account.Request access
People who inject drugs in 23 metropolitan statistical areas (MSAs)
Supplementary notes
* Receptive syringe sharing was defined as “using needles that someone else had already injected with,” and receptive injection equipment sharing was defined as
using equipment such as cookers, cottons, or water used to rinse needles or prepare drugs “that someone else had already used.” Condomless vaginal or anal sex
was defined as “sex without a condom.”
Figures include data from 23 metropolitan statistical areas (MSAs). These areas included Atlanta, Georgia; Baltimore, Maryland; Boston, Massachusetts; Chicago,
Illinois; Dallas, Texas; Denver, Colorado; Detroit, Michigan; Houston, Texas;
Los Angeles, California; Memphis, Tennessee; Miami, Florida; Nassau-Suffolk,
New York; New Orleans, Louisiana; New York, New York; Newark, New Jersey;
Philadelphia, Pennsylvania; Portland, Oregon; San Diego, California; San
Francisco, California; San Juan, Puerto Rico; Seattle, Washington; Virginia
Beach, Virginia; Washington, District of Columbia.
Learn more about how Statista can support your business.
CDC, & MMWR. (October 22, 2021). Percentage of people in the U.S. who injected drugs and who were HIV-negative, but engaged in select behaviors in the past year as of 2018 [Graph]. In Statista. Retrieved May 11, 2025, from https://www.statista.com/statistics/805427/behaviors-among-hiv-negative-people-who-inject-drugs-us/
CDC, und MMWR. "Percentage of people in the U.S. who injected drugs and who were HIV-negative, but engaged in select behaviors in the past year as of 2018." Chart. October 22, 2021. Statista. Accessed May 11, 2025. https://www.statista.com/statistics/805427/behaviors-among-hiv-negative-people-who-inject-drugs-us/
CDC, MMWR. (2021). Percentage of people in the U.S. who injected drugs and who were HIV-negative, but engaged in select behaviors in the past year as of 2018. Statista. Statista Inc.. Accessed: May 11, 2025. https://www.statista.com/statistics/805427/behaviors-among-hiv-negative-people-who-inject-drugs-us/
CDC, and MMWR. "Percentage of People in The U.S. Who Injected Drugs and Who Were Hiv-negative, but Engaged in Select Behaviors in The past Year as of 2018." Statista, Statista Inc., 22 Oct 2021, https://www.statista.com/statistics/805427/behaviors-among-hiv-negative-people-who-inject-drugs-us/
CDC & MMWR, Percentage of people in the U.S. who injected drugs and who were HIV-negative, but engaged in select behaviors in the past year as of 2018 Statista, https://www.statista.com/statistics/805427/behaviors-among-hiv-negative-people-who-inject-drugs-us/ (last visited May 11, 2025)
Percentage of people in the U.S. who injected drugs and who were HIV-negative, but engaged in select behaviors in the past year as of 2018 [Graph], CDC, & MMWR, October 22, 2021. [Online]. Available: https://www.statista.com/statistics/805427/behaviors-among-hiv-negative-people-who-inject-drugs-us/
Profit from additional features with an Employee Account
Please create an employee account to be able to mark statistics as favorites.
Then you can access your favorite statistics via the star in the header.
Profit from the additional features of your individual account
Currently, you are using a shared account. To use individual functions (e.g., mark statistics as favourites, set
statistic alerts) please log in with your personal account.
If you are an admin, please authenticate by logging in again.