This statistic presents the percentage of people in the U.S. who injected drugs and who were HIV-negative and who received testing and HIV prevention services as of 2018. During that year, 57 percent of people who injected drugs and were HIV-negative had been tested for HIV infection in the past 12 months.
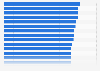
Percentage of people in the U.S. who injected drugs and were HIV-negative and who received testing and HIV prevention services as of 2018
Characteristic
Percentage of people who inject drugs
Tested for HIV infection in the previous 12 months
57%
Participated in HIV behavioral interventions in the previous 12 months*
33%
Ever tested for hepatitis C
83%
Received syringes from SSP in the previous 12 months**
46%
Received syringes from sterile sources only in the previous 12 months**
55%
0%10%20%30%40%50%60%70%80%90%100%
Add this content to your personal favorites. These can be accessed from the favorites menu in the main navigation.
You have no right to use this feature.
Make sure to contact us if you are interested in scientific citation.
You can upgrade your account to enable this functionality for all statistics.
This feature is not available with your current account.Request access
People who inject drugs in 23 metropolitan statistical areas (MSAs)
Supplementary notes
* Participating in an individual or group HIV behavioral intervention (e.g., a one-on-one conversation with a counselor or an organized discussion regarding HIV
prevention) did not include counseling received as part of an HIV test or conversations with friends.
** Receiving a syringe from a syringe services program (SSP) was defined as reporting receiving a sterile syringe or needles at least once from an SSP or syringe/needle
exchange program. Receiving syringes from sterile sources only included reporting receiving syringes from at least one of the following: SSP, pharmacy, or healthcare
provider and not any other sources during the previous 12 months.
Figures include data from 23 metropolitan statistical areas (MSAs). These areas included Atlanta, Georgia; Baltimore, Maryland; Boston, Massachusetts; Chicago,
Illinois; Dallas, Texas; Denver, Colorado; Detroit, Michigan; Houston, Texas;
Los Angeles, California; Memphis, Tennessee; Miami, Florida; Nassau-Suffolk,
New York; New Orleans, Louisiana; New York, New York; Newark, New Jersey;
Philadelphia, Pennsylvania; Portland, Oregon; San Diego, California; San
Francisco, California; San Juan, Puerto Rico; Seattle, Washington; Virginia
Beach, Virginia; Washington, District of Columbia.
Learn more about how Statista can support your business.
CDC, & MMWR. (January 22, 2021). Percentage of people in the U.S. who injected drugs and were HIV-negative and who received testing and HIV prevention services as of 2018 [Graph]. In Statista. Retrieved May 13, 2025, from https://www.statista.com/statistics/805446/hiv-prevention-services-among-hiv-negative-people-who-inject-drugs-us/
CDC, und MMWR. "Percentage of people in the U.S. who injected drugs and were HIV-negative and who received testing and HIV prevention services as of 2018." Chart. January 22, 2021. Statista. Accessed May 13, 2025. https://www.statista.com/statistics/805446/hiv-prevention-services-among-hiv-negative-people-who-inject-drugs-us/
CDC, MMWR. (2021). Percentage of people in the U.S. who injected drugs and were HIV-negative and who received testing and HIV prevention services as of 2018. Statista. Statista Inc.. Accessed: May 13, 2025. https://www.statista.com/statistics/805446/hiv-prevention-services-among-hiv-negative-people-who-inject-drugs-us/
CDC, and MMWR. "Percentage of People in The U.S. Who Injected Drugs and Were Hiv-negative and Who Received Testing and Hiv Prevention Services as of 2018." Statista, Statista Inc., 22 Jan 2021, https://www.statista.com/statistics/805446/hiv-prevention-services-among-hiv-negative-people-who-inject-drugs-us/
CDC & MMWR, Percentage of people in the U.S. who injected drugs and were HIV-negative and who received testing and HIV prevention services as of 2018 Statista, https://www.statista.com/statistics/805446/hiv-prevention-services-among-hiv-negative-people-who-inject-drugs-us/ (last visited May 13, 2025)
Percentage of people in the U.S. who injected drugs and were HIV-negative and who received testing and HIV prevention services as of 2018 [Graph], CDC, & MMWR, January 22, 2021. [Online]. Available: https://www.statista.com/statistics/805446/hiv-prevention-services-among-hiv-negative-people-who-inject-drugs-us/
Profit from additional features with an Employee Account
Please create an employee account to be able to mark statistics as favorites.
Then you can access your favorite statistics via the star in the header.
Profit from the additional features of your individual account
Currently, you are using a shared account. To use individual functions (e.g., mark statistics as favourites, set
statistic alerts) please log in with your personal account.
If you are an admin, please authenticate by logging in again.