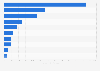
This statistic shows the results of a survey conducted from October to November 2017 among adult Americans on their preference for bathroom tissue. The results were sorted based on whether or not children were present in respondents' households. During the survey, 27.1 percent of respondents from households with children present stated they prefer Scott bathroom tissue; 16.3 percent of respondents from households without children said the same.
Advertisement
Advertisement
United States: Brand preferences for bathroom tissue from October to November 2017, by presence of children in the household
Profit from the additional features of your individual account
Currently, you are using a shared account. To use individual functions (e.g., mark statistics as favourites, set
statistic alerts) please log in with your personal account.
If you are an admin, please authenticate by logging in again.
Learn more about how Statista can support your business.
The Brand Strength Monitor. (January 23, 2018). United States: Brand preferences for bathroom tissue from October to November 2017, by presence of children in the household [Graph]. In Statista. Retrieved June 17, 2025, from https://www.statista.com/statistics/806491/us-brand-preferences-for-bathroom-tissue-by-children-present/
The Brand Strength Monitor. "United States: Brand preferences for bathroom tissue from October to November 2017, by presence of children in the household." Chart. January 23, 2018. Statista. Accessed June 17, 2025. https://www.statista.com/statistics/806491/us-brand-preferences-for-bathroom-tissue-by-children-present/
The Brand Strength Monitor. (2018). United States: Brand preferences for bathroom tissue from October to November 2017, by presence of children in the household. Statista. Statista Inc.. Accessed: June 17, 2025. https://www.statista.com/statistics/806491/us-brand-preferences-for-bathroom-tissue-by-children-present/
The Brand Strength Monitor. "United States: Brand Preferences for Bathroom Tissue from October to November 2017, by Presence of Children in The Household." Statista, Statista Inc., 23 Jan 2018, https://www.statista.com/statistics/806491/us-brand-preferences-for-bathroom-tissue-by-children-present/
The Brand Strength Monitor, United States: Brand preferences for bathroom tissue from October to November 2017, by presence of children in the household Statista, https://www.statista.com/statistics/806491/us-brand-preferences-for-bathroom-tissue-by-children-present/ (last visited June 17, 2025)
United States: Brand preferences for bathroom tissue from October to November 2017, by presence of children in the household [Graph], The Brand Strength Monitor, January 23, 2018. [Online]. Available: https://www.statista.com/statistics/806491/us-brand-preferences-for-bathroom-tissue-by-children-present/