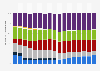
This statistic illustrates the average revenue per fixed voice call connection in the United Kingdom (UK), from 2011 to 2016. The average revenue per connection fell steadily until 2016, increasing for the first time during this period to 21.13 British pounds. Total average revenue consisted of line rental and bundle, UK Geographic calls, International calls, calls to mobiles and other calls.
In 2016, fixed line rental and bundle accounted for 15.76 British pounds of the total figure of 21.23 British pounds.
Average revenue per fixed voice connection in the United Kingdom (UK) from 2011 to 2016
(in GBP per month)
Characteristic
Average revenue in British pounds per month
2016
21.13
2015
20.93
2014
21.14
2013
22.11
2012
22.94
2011
24.18
051015202530
Add this content to your personal favorites. These can be accessed from the favorites menu in the main navigation.
You have no right to use this feature.
Make sure to contact us if you are interested in scientific citation.
You can upgrade your account to enable this functionality for all statistics.
This feature is not available with your current account.Request access
Learn more about how Statista can support your business.
Ofcom. (August 3, 2017). Average revenue per fixed voice connection in the United Kingdom (UK) from 2011 to 2016 (in GBP per month) [Graph]. In Statista. Retrieved June 11, 2025, from https://www.statista.com/statistics/807610/average-revenue-per-fixed-voice-call-connection-uk/
Ofcom. "Average revenue per fixed voice connection in the United Kingdom (UK) from 2011 to 2016 (in GBP per month)." Chart. August 3, 2017. Statista. Accessed June 11, 2025. https://www.statista.com/statistics/807610/average-revenue-per-fixed-voice-call-connection-uk/
Ofcom. (2017). Average revenue per fixed voice connection in the United Kingdom (UK) from 2011 to 2016 (in GBP per month). Statista. Statista Inc.. Accessed: June 11, 2025. https://www.statista.com/statistics/807610/average-revenue-per-fixed-voice-call-connection-uk/
Ofcom. "Average Revenue per Fixed Voice Connection in The United Kingdom (Uk) from 2011 to 2016 (in Gbp per Month)." Statista, Statista Inc., 3 Aug 2017, https://www.statista.com/statistics/807610/average-revenue-per-fixed-voice-call-connection-uk/
Ofcom, Average revenue per fixed voice connection in the United Kingdom (UK) from 2011 to 2016 (in GBP per month) Statista, https://www.statista.com/statistics/807610/average-revenue-per-fixed-voice-call-connection-uk/ (last visited June 11, 2025)
Average revenue per fixed voice connection in the United Kingdom (UK) from 2011 to 2016 (in GBP per month) [Graph], Ofcom, August 3, 2017. [Online]. Available: https://www.statista.com/statistics/807610/average-revenue-per-fixed-voice-call-connection-uk/
Profit from additional features with an Employee Account
Please create an employee account to be able to mark statistics as favorites.
Then you can access your favorite statistics via the star in the header.
Profit from the additional features of your individual account
Currently, you are using a shared account. To use individual functions (e.g., mark statistics as favourites, set
statistic alerts) please log in with your personal account.
If you are an admin, please authenticate by logging in again.