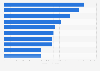
This statistic shows the result of a survey on the share of GPs who do not use but who are interested in using medical mobile applications in Italy in 2017, by type of app. As of survey data, most of the respondents (63 percent) declared they would be interested in using apps to analyze patients’ data and apps to link the smartphone to medical devices. The kind of apps towards which there was less interest where the ones to train doctors with quiz, videos and simulations.
Share of GPs who do not use but are interested in using medical mobile applications in Italy in 2017, by type of app
Characteristic
Share of GPs
The ones to analyze patients’ data and provide specific diagnosis or therapeutic indications
63%
The ones to link the smartphone/tablet with medical devices in order to view, save, analyze and send patient’s data coming from the medical device
63%
The ones to memorize states of health and monitoring the therapies assigned
60%
The ones to make the smartphone/tablet a medical device itself
60%
The ones to screen and identify risk factors
58%
The ones to consult information and guidelines
47%
The ones to manage appointments
45%
The ones with supporting functions such as enlargers, audio recorders, communication and localization systems
43%
The ones to consult electronic copies of reports, scientific articles, glossaries, etc.
43%
The ones to train doctors with quiz, videos and simulations
41%
0%5%10%15%20%25%30%35%40%45%50%55%60%65%70%
Add this content to your personal favorites. These can be accessed from the favorites menu in the main navigation.
You have no right to use this feature.
Make sure to contact us if you are interested in scientific citation.
You can upgrade your account to enable this functionality for all statistics.
This feature is not available with your current account.Request access
Learn more about how Statista can support your business.
Osservatori Digital Innovation. (April 10, 2017). Share of GPs who do not use but are interested in using medical mobile applications in Italy in 2017, by type of app [Graph]. In Statista. Retrieved June 10, 2025, from https://www.statista.com/statistics/807864/share-of-gps-who-are-interested-to-use-medical-apps-by-type/
Osservatori Digital Innovation. "Share of GPs who do not use but are interested in using medical mobile applications in Italy in 2017, by type of app." Chart. April 10, 2017. Statista. Accessed June 10, 2025. https://www.statista.com/statistics/807864/share-of-gps-who-are-interested-to-use-medical-apps-by-type/
Osservatori Digital Innovation. (2017). Share of GPs who do not use but are interested in using medical mobile applications in Italy in 2017, by type of app. Statista. Statista Inc.. Accessed: June 10, 2025. https://www.statista.com/statistics/807864/share-of-gps-who-are-interested-to-use-medical-apps-by-type/
Osservatori Digital Innovation. "Share of Gps Who Do Not Use but Are Interested in Using Medical Mobile Applications in Italy in 2017, by Type of App." Statista, Statista Inc., 10 Apr 2017, https://www.statista.com/statistics/807864/share-of-gps-who-are-interested-to-use-medical-apps-by-type/
Osservatori Digital Innovation, Share of GPs who do not use but are interested in using medical mobile applications in Italy in 2017, by type of app Statista, https://www.statista.com/statistics/807864/share-of-gps-who-are-interested-to-use-medical-apps-by-type/ (last visited June 10, 2025)
Share of GPs who do not use but are interested in using medical mobile applications in Italy in 2017, by type of app [Graph], Osservatori Digital Innovation, April 10, 2017. [Online]. Available: https://www.statista.com/statistics/807864/share-of-gps-who-are-interested-to-use-medical-apps-by-type/
Profit from additional features with an Employee Account
Please create an employee account to be able to mark statistics as favorites.
Then you can access your favorite statistics via the star in the header.
Profit from the additional features of your individual account
Currently, you are using a shared account. To use individual functions (e.g., mark statistics as favourites, set
statistic alerts) please log in with your personal account.
If you are an admin, please authenticate by logging in again.