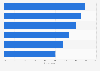
This statistic shows the share of customers worldwide by their opinion about the most frustrating aspect of a poor customer service experience in 2018, by age. During the survey, 26 percent of respondents, aged between 18 and 34 years, cited not being able to resolve their issue on their own using self-service as one of the most frustrating aspect of a poor customer service experience.
Advertisement
Advertisement
Share of customers worldwide by poor customer service experiences in 2018, by age
Characteristic
Ages 18 to 34
Ages 35 to 54
Ages 55 and older
Not being able to resolve the issue on my own using self-service
17%
12%
8%
Difficulty reaching or inability to reach a live agent
18%
19%
25%
The representative lacks the knowledge or ability to resolve my issue
36%
37%
35%
Having to repeat or provide my information multiple times
You have no right to use this feature.
Make sure to contact us if you are interested in scientific citation.
You can upgrade your account to enable this functionality for all statistics.
This feature is not available with your current account.Request access
Learn more about how Statista can support your business.
Microsoft. (March 14, 2019). Share of customers worldwide by poor customer service experiences in 2018, by age [Graph]. In Statista. Retrieved June 12, 2025, from https://www.statista.com/statistics/810594/share-of-customers-by-poor-customer-service-experiences-by-age/
Microsoft. "Share of customers worldwide by poor customer service experiences in 2018, by age." Chart. March 14, 2019. Statista. Accessed June 12, 2025. https://www.statista.com/statistics/810594/share-of-customers-by-poor-customer-service-experiences-by-age/
Microsoft. (2019). Share of customers worldwide by poor customer service experiences in 2018, by age. Statista. Statista Inc.. Accessed: June 12, 2025. https://www.statista.com/statistics/810594/share-of-customers-by-poor-customer-service-experiences-by-age/
Microsoft. "Share of Customers Worldwide by Poor Customer Service Experiences in 2018, by Age." Statista, Statista Inc., 14 Mar 2019, https://www.statista.com/statistics/810594/share-of-customers-by-poor-customer-service-experiences-by-age/
Microsoft, Share of customers worldwide by poor customer service experiences in 2018, by age Statista, https://www.statista.com/statistics/810594/share-of-customers-by-poor-customer-service-experiences-by-age/ (last visited June 12, 2025)
Share of customers worldwide by poor customer service experiences in 2018, by age [Graph], Microsoft, March 14, 2019. [Online]. Available: https://www.statista.com/statistics/810594/share-of-customers-by-poor-customer-service-experiences-by-age/
Advertisement
Profit from additional features with an Employee Account
Please create an employee account to be able to mark statistics as favorites.
Then you can access your favorite statistics via the star in the header.
Profit from the additional features of your individual account
Currently, you are using a shared account. To use individual functions (e.g., mark statistics as favourites, set
statistic alerts) please log in with your personal account.
If you are an admin, please authenticate by logging in again.