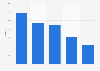
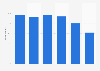
This statistic shows the most frequent smartphone uses among users in Peru in 2016 and 2017. In 2017, 81 percent of smartphone users in Peru stated they used smartphones to access social media, while 80 percent claimed to use them for basic communication.
Most frequent smartphone uses among users in Peru in 2016 and 2017
Profit from the additional features of your individual account
Currently, you are using a shared account. To use individual functions (e.g., mark statistics as favourites, set
statistic alerts) please log in with your personal account.
If you are an admin, please authenticate by logging in again.
Learn more about how Statista can support your business.
Ipsos (Peru). (March 5, 2018). Most frequent smartphone uses among users in Peru in 2016 and 2017 [Graph]. In Statista. Retrieved May 02, 2025, from https://www.statista.com/statistics/818878/most-frequent-smartphone-uses-among-users-peru/
Ipsos (Peru). "Most frequent smartphone uses among users in Peru in 2016 and 2017." Chart. March 5, 2018. Statista. Accessed May 02, 2025. https://www.statista.com/statistics/818878/most-frequent-smartphone-uses-among-users-peru/
Ipsos (Peru). (2018). Most frequent smartphone uses among users in Peru in 2016 and 2017. Statista. Statista Inc.. Accessed: May 02, 2025. https://www.statista.com/statistics/818878/most-frequent-smartphone-uses-among-users-peru/
Ipsos (Peru). "Most Frequent Smartphone Uses among Users in Peru in 2016 and 2017." Statista, Statista Inc., 5 Mar 2018, https://www.statista.com/statistics/818878/most-frequent-smartphone-uses-among-users-peru/
Ipsos (Peru), Most frequent smartphone uses among users in Peru in 2016 and 2017 Statista, https://www.statista.com/statistics/818878/most-frequent-smartphone-uses-among-users-peru/ (last visited May 02, 2025)
Most frequent smartphone uses among users in Peru in 2016 and 2017 [Graph], Ipsos (Peru), March 5, 2018. [Online]. Available: https://www.statista.com/statistics/818878/most-frequent-smartphone-uses-among-users-peru/