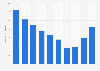
In 2024, Samsung Heavy Industries' sales revenue amounted to approximately 9.9 trillion South Korean won. This was an increase from the previous year, and the highest figure recorded since 2016.
Profit from the additional features of your individual account
Currently, you are using a shared account. To use individual functions (e.g., mark statistics as favourites, set
statistic alerts) please log in with your personal account.
If you are an admin, please authenticate by logging in again.
Learn more about how Statista can support your business.
DART. (March 18, 2025). Revenue of Samsung Heavy Industries from 2015 to 2024 (in trillion South Korean won) [Graph]. In Statista. Retrieved June 08, 2025, from https://www.statista.com/statistics/821530/south-korea-samsung-heavy-industries-sales-revenue/
DART. "Revenue of Samsung Heavy Industries from 2015 to 2024 (in trillion South Korean won)." Chart. March 18, 2025. Statista. Accessed June 08, 2025. https://www.statista.com/statistics/821530/south-korea-samsung-heavy-industries-sales-revenue/
DART. (2025). Revenue of Samsung Heavy Industries from 2015 to 2024 (in trillion South Korean won). Statista. Statista Inc.. Accessed: June 08, 2025. https://www.statista.com/statistics/821530/south-korea-samsung-heavy-industries-sales-revenue/
DART. "Revenue of Samsung Heavy Industries from 2015 to 2024 (in Trillion South Korean Won)." Statista, Statista Inc., 18 Mar 2025, https://www.statista.com/statistics/821530/south-korea-samsung-heavy-industries-sales-revenue/
DART, Revenue of Samsung Heavy Industries from 2015 to 2024 (in trillion South Korean won) Statista, https://www.statista.com/statistics/821530/south-korea-samsung-heavy-industries-sales-revenue/ (last visited June 08, 2025)
Revenue of Samsung Heavy Industries from 2015 to 2024 (in trillion South Korean won) [Graph], DART, March 18, 2025. [Online]. Available: https://www.statista.com/statistics/821530/south-korea-samsung-heavy-industries-sales-revenue/