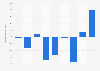
The statistic shows the satisfaction rates of Uber users in the United States in 2016. During the survey, 78 percent of Uber users stated that they were extremely or very satisfied with their ridesharing service.
Advertisement
Advertisement
Satisfaction rates of Uber users in the United States in 2016
Profit from the additional features of your individual account
Currently, you are using a shared account. To use individual functions (e.g., mark statistics as favourites, set
statistic alerts) please log in with your personal account.
If you are an admin, please authenticate by logging in again.
Learn more about how Statista can support your business.
SharesPost. (January 18, 2017). Satisfaction rates of Uber users in the United States in 2016 [Graph]. In Statista. Retrieved June 20, 2025, from https://www.statista.com/statistics/823528/uber-users-satisfaction-rates-us/
SharesPost. "Satisfaction rates of Uber users in the United States in 2016." Chart. January 18, 2017. Statista. Accessed June 20, 2025. https://www.statista.com/statistics/823528/uber-users-satisfaction-rates-us/
SharesPost. (2017). Satisfaction rates of Uber users in the United States in 2016. Statista. Statista Inc.. Accessed: June 20, 2025. https://www.statista.com/statistics/823528/uber-users-satisfaction-rates-us/
SharesPost. "Satisfaction Rates of Uber Users in The United States in 2016." Statista, Statista Inc., 18 Jan 2017, https://www.statista.com/statistics/823528/uber-users-satisfaction-rates-us/
SharesPost, Satisfaction rates of Uber users in the United States in 2016 Statista, https://www.statista.com/statistics/823528/uber-users-satisfaction-rates-us/ (last visited June 20, 2025)
Satisfaction rates of Uber users in the United States in 2016 [Graph], SharesPost, January 18, 2017. [Online]. Available: https://www.statista.com/statistics/823528/uber-users-satisfaction-rates-us/