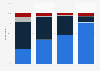
This statistic presents the daily television consumption on selected devices in the United States as of *************, by city. According to the source, **** percent of daily television usage among streamers in New York was carried out only through streaming devices.
Profit from the additional features of your individual account
Currently, you are using a shared account. To use individual functions (e.g., mark statistics as favourites, set
statistic alerts) please log in with your personal account.
If you are an admin, please authenticate by logging in again.
Learn more about how Statista can support your business.
Nielsen. (May 7, 2018). Daily television consumption on selected devices in the United States as of November 2017, by city [Graph]. In Statista. Retrieved July 11, 2025, from https://www.statista.com/statistics/859662/tv-consumption-device-city/
Nielsen. "Daily television consumption on selected devices in the United States as of November 2017, by city." Chart. May 7, 2018. Statista. Accessed July 11, 2025. https://www.statista.com/statistics/859662/tv-consumption-device-city/
Nielsen. (2018). Daily television consumption on selected devices in the United States as of November 2017, by city. Statista. Statista Inc.. Accessed: July 11, 2025. https://www.statista.com/statistics/859662/tv-consumption-device-city/
Nielsen. "Daily Television Consumption on Selected Devices in The United States as of November 2017, by City." Statista, Statista Inc., 7 May 2018, https://www.statista.com/statistics/859662/tv-consumption-device-city/
Nielsen, Daily television consumption on selected devices in the United States as of November 2017, by city Statista, https://www.statista.com/statistics/859662/tv-consumption-device-city/ (last visited July 11, 2025)
Daily television consumption on selected devices in the United States as of November 2017, by city [Graph], Nielsen, May 7, 2018. [Online]. Available: https://www.statista.com/statistics/859662/tv-consumption-device-city/