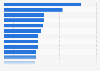
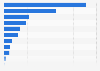
Natural gas pipelines with an expected capacity of ** million cubic feet per day (MMcf/d) were certified to be added to the existing U.S. pipeline network as of December 2022. During the same time, the capacity of proposed projects was ***** MMcf/d.
Profit from the additional features of your individual account
Currently, you are using a shared account. To use individual functions (e.g., mark statistics as favourites, set
statistic alerts) please log in with your personal account.
If you are an admin, please authenticate by logging in again.
Learn more about how Statista can support your business.
FERC. (February 7, 2023). Capacity of natural gas pipelines under development in the United States in December 2022, by status (in million cubic feet per day) [Graph]. In Statista. Retrieved July 15, 2025, from https://www.statista.com/statistics/861655/us-natural-gas-pipeline-activities-capacity/
FERC. "Capacity of natural gas pipelines under development in the United States in December 2022, by status (in million cubic feet per day)." Chart. February 7, 2023. Statista. Accessed July 15, 2025. https://www.statista.com/statistics/861655/us-natural-gas-pipeline-activities-capacity/
FERC. (2023). Capacity of natural gas pipelines under development in the United States in December 2022, by status (in million cubic feet per day). Statista. Statista Inc.. Accessed: July 15, 2025. https://www.statista.com/statistics/861655/us-natural-gas-pipeline-activities-capacity/
FERC. "Capacity of Natural Gas Pipelines under Development in The United States in December 2022, by Status (in Million Cubic Feet per Day)." Statista, Statista Inc., 7 Feb 2023, https://www.statista.com/statistics/861655/us-natural-gas-pipeline-activities-capacity/
FERC, Capacity of natural gas pipelines under development in the United States in December 2022, by status (in million cubic feet per day) Statista, https://www.statista.com/statistics/861655/us-natural-gas-pipeline-activities-capacity/ (last visited July 15, 2025)
Capacity of natural gas pipelines under development in the United States in December 2022, by status (in million cubic feet per day) [Graph], FERC, February 7, 2023. [Online]. Available: https://www.statista.com/statistics/861655/us-natural-gas-pipeline-activities-capacity/