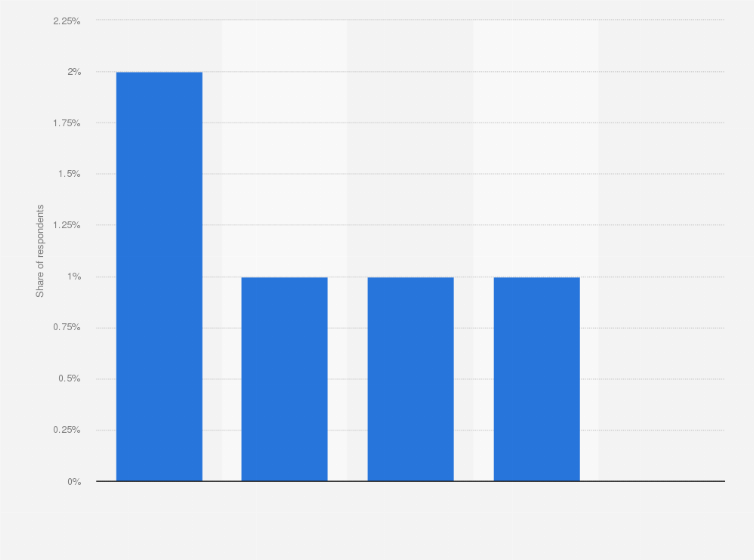
This statistic shows the virtual reality device penetration in Finland in 2017, by age group. According to the survey, the virtual reality penetration rate was the highest among 15 to 25-year-olds (two percent), and the lowest among people aged 56 years or older (zero percent).
Adjust the presentation of the statistic and data points.
Share the statistic on social media channels or embed the statistic in your
website using "Embed Code", where available.
Cite this statistic and select one of the following formats: APA, Chicago, Harvard, MLA & Bluebook.
Print the statistic including description and metadata.
Chart type
Share of respondents with a virtual reality device in Finland in 2017, by age group
Share this statistic
You have no right to use this feature.
Make sure to contact us if you are interested in scientific citation.
You can upgrade your account to enable this functionality for all statistics.
This feature is not available with your current account.Request access
*The source adds the following information: "The respondents have been selected from our Nordic, UK and US panels consisting of more than 1 million panelists and weighed to achieve representativity on the more than 14,000 respondents who completed the survey."
Learn more about how Statista can support your business.
AudienceProject. (May 23, 2017). Share of respondents with a virtual reality device in Finland in 2017, by age group [Graph]. In Statista. Retrieved June 28, 2025, from https://www.statista.com/statistics/863644/virtual-reality-device-penetration-in-by-age-group-finland/
AudienceProject. "Share of respondents with a virtual reality device in Finland in 2017, by age group." Chart. May 23, 2017. Statista. Accessed June 28, 2025. https://www.statista.com/statistics/863644/virtual-reality-device-penetration-in-by-age-group-finland/
AudienceProject. (2017). Share of respondents with a virtual reality device in Finland in 2017, by age group. Statista. Statista Inc.. Accessed: June 28, 2025. https://www.statista.com/statistics/863644/virtual-reality-device-penetration-in-by-age-group-finland/
AudienceProject. "Share of Respondents with a Virtual Reality Device in Finland in 2017, by Age Group." Statista, Statista Inc., 23 May 2017, https://www.statista.com/statistics/863644/virtual-reality-device-penetration-in-by-age-group-finland/
AudienceProject, Share of respondents with a virtual reality device in Finland in 2017, by age group Statista, https://www.statista.com/statistics/863644/virtual-reality-device-penetration-in-by-age-group-finland/ (last visited June 28, 2025)
Share of respondents with a virtual reality device in Finland in 2017, by age group [Graph], AudienceProject, May 23, 2017. [Online]. Available: https://www.statista.com/statistics/863644/virtual-reality-device-penetration-in-by-age-group-finland/
Advertisement
Profit from additional features with an Employee Account
Please create an employee account to be able to mark statistics as favorites.
Then you can access your favorite statistics via the star in the header.
Profit from the additional features of your individual account
Currently, you are using a shared account. To use individual functions (e.g., mark statistics as favourites, set
statistic alerts) please log in with your personal account.
If you are an admin, please authenticate by logging in again.