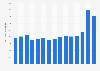
In 2024, the total bunker sales amounted to approximately 55 million metric tons. The highest bunker sales over the period were recorded in the same year.
Advertisement
Advertisement
Total bunker sales in Singapore from 2015 to 2024
(in million metric tons)
Profit from the additional features of your individual account
Currently, you are using a shared account. To use individual functions (e.g., mark statistics as favourites, set
statistic alerts) please log in with your personal account.
If you are an admin, please authenticate by logging in again.
Learn more about how Statista can support your business.
Maritime and Port Authority Singapore. (January 23, 2025). Total bunker sales in Singapore from 2015 to 2024 (in million metric tons) [Graph]. In Statista. Retrieved June 17, 2025, from https://www.statista.com/statistics/870575/singapore-bunker-sales/
Maritime and Port Authority Singapore. "Total bunker sales in Singapore from 2015 to 2024 (in million metric tons)." Chart. January 23, 2025. Statista. Accessed June 17, 2025. https://www.statista.com/statistics/870575/singapore-bunker-sales/
Maritime and Port Authority Singapore. (2025). Total bunker sales in Singapore from 2015 to 2024 (in million metric tons). Statista. Statista Inc.. Accessed: June 17, 2025. https://www.statista.com/statistics/870575/singapore-bunker-sales/
Maritime and Port Authority Singapore. "Total Bunker Sales in Singapore from 2015 to 2024 (in Million Metric Tons)." Statista, Statista Inc., 23 Jan 2025, https://www.statista.com/statistics/870575/singapore-bunker-sales/
Maritime and Port Authority Singapore, Total bunker sales in Singapore from 2015 to 2024 (in million metric tons) Statista, https://www.statista.com/statistics/870575/singapore-bunker-sales/ (last visited June 17, 2025)
Total bunker sales in Singapore from 2015 to 2024 (in million metric tons) [Graph], Maritime and Port Authority Singapore, January 23, 2025. [Online]. Available: https://www.statista.com/statistics/870575/singapore-bunker-sales/