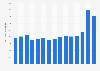
In 2024, approximately 26 thousand tankers arrived in Singapore. This is a slight increase from the previous year, when 24.76 thousand tankers arrived.
Advertisement
Advertisement
Number of tanker arrivals in Singapore from 2015 to 2024
(in 1000s)
Profit from the additional features of your individual account
Currently, you are using a shared account. To use individual functions (e.g., mark statistics as favourites, set
statistic alerts) please log in with your personal account.
If you are an admin, please authenticate by logging in again.
Learn more about how Statista can support your business.
Maritime and Port Authority Singapore. (January 23, 2025). Number of tanker arrivals in Singapore from 2015 to 2024 (in 1000s) [Graph]. In Statista. Retrieved June 17, 2025, from https://www.statista.com/statistics/870623/singapore-tanker-arrivals/
Maritime and Port Authority Singapore. "Number of tanker arrivals in Singapore from 2015 to 2024 (in 1000s)." Chart. January 23, 2025. Statista. Accessed June 17, 2025. https://www.statista.com/statistics/870623/singapore-tanker-arrivals/
Maritime and Port Authority Singapore. (2025). Number of tanker arrivals in Singapore from 2015 to 2024 (in 1000s). Statista. Statista Inc.. Accessed: June 17, 2025. https://www.statista.com/statistics/870623/singapore-tanker-arrivals/
Maritime and Port Authority Singapore. "Number of Tanker Arrivals in Singapore from 2015 to 2024 (in 1000s)." Statista, Statista Inc., 23 Jan 2025, https://www.statista.com/statistics/870623/singapore-tanker-arrivals/
Maritime and Port Authority Singapore, Number of tanker arrivals in Singapore from 2015 to 2024 (in 1000s) Statista, https://www.statista.com/statistics/870623/singapore-tanker-arrivals/ (last visited June 17, 2025)
Number of tanker arrivals in Singapore from 2015 to 2024 (in 1000s) [Graph], Maritime and Port Authority Singapore, January 23, 2025. [Online]. Available: https://www.statista.com/statistics/870623/singapore-tanker-arrivals/