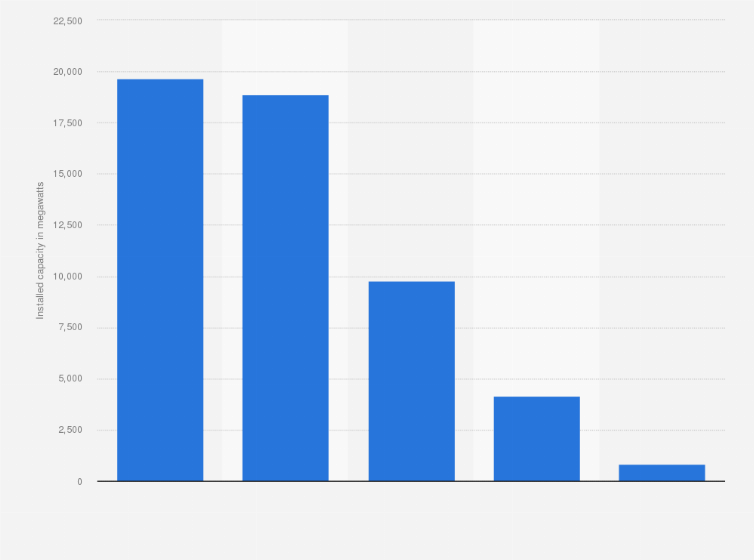
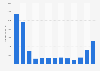
This statistic depicts the cumulative installed capacity in Italy in 2017, by source. According to data, solar power led the ranking, with an installed capacity of 19,682 megawatts, followed by hydropower, whose installed capacity amounted to 18,863 megawatts as of the end of 2017.
Adjust the presentation of the statistic and data points.
Share the statistic on social media channels or embed the statistic in your
website using "Embed Code", where available.
Cite this statistic and select one of the following formats: APA, Chicago, Harvard, MLA & Bluebook.
Print the statistic including description and metadata.
Chart type
Cumulative installed capacity in Italy in 2018, by source
Share this statistic
You have no right to use this feature.
Make sure to contact us if you are interested in scientific citation.
You can upgrade your account to enable this functionality for all statistics.
This feature is not available with your current account.Request access
Learn more about how Statista can support your business.
Energy & Strategy Group. (May 9, 2019). Cumulative installed capacity in Italy in 2018, by source (in megawatts) [Graph]. In Statista. Retrieved May 28, 2025, from https://www.statista.com/statistics/873560/cumulative-installed-capacity-by-source-in-italy/
Energy & Strategy Group. "Cumulative installed capacity in Italy in 2018, by source (in megawatts)." Chart. May 9, 2019. Statista. Accessed May 28, 2025. https://www.statista.com/statistics/873560/cumulative-installed-capacity-by-source-in-italy/
Energy & Strategy Group. (2019). Cumulative installed capacity in Italy in 2018, by source (in megawatts). Statista. Statista Inc.. Accessed: May 28, 2025. https://www.statista.com/statistics/873560/cumulative-installed-capacity-by-source-in-italy/
Energy & Strategy Group. "Cumulative Installed Capacity in Italy in 2018, by Source (in Megawatts)." Statista, Statista Inc., 9 May 2019, https://www.statista.com/statistics/873560/cumulative-installed-capacity-by-source-in-italy/
Energy & Strategy Group, Cumulative installed capacity in Italy in 2018, by source (in megawatts) Statista, https://www.statista.com/statistics/873560/cumulative-installed-capacity-by-source-in-italy/ (last visited May 28, 2025)
Cumulative installed capacity in Italy in 2018, by source (in megawatts) [Graph], Energy & Strategy Group, May 9, 2019. [Online]. Available: https://www.statista.com/statistics/873560/cumulative-installed-capacity-by-source-in-italy/
Profit from additional features with an Employee Account
Please create an employee account to be able to mark statistics as favorites.
Then you can access your favorite statistics via the star in the header.
Profit from the additional features of your individual account
Currently, you are using a shared account. To use individual functions (e.g., mark statistics as favourites, set
statistic alerts) please log in with your personal account.
If you are an admin, please authenticate by logging in again.