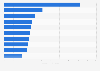
This statistic depicts the percentage of select orphan drugs that were utilized in select way in the U.S. between 2012 to 2014, by utilization type. According to the data, 95 percent of Gralise usage was for off-label use. Orphan drugs, once approved, are sometimes expanded to cover several other indications. In fact, many orphan drugs are utilized more often in non-orphan areas than in the original aimed orphan area.
Advertisement
Advertisement
Percentage of annual utilization among select orphan drugs in the U.S. from 2012 to 2014, by usage type
You have no right to use this feature.
Make sure to contact us if you are interested in scientific citation.
You can upgrade your account to enable this functionality for all statistics.
This feature is not available with your current account.Request access
* The cumulative price change is based on changes in the unit price for NDC #00173-0806-01 & #53451-0101-01.
** As Iclusig was not approved by the FDA until December, 2012 it was included in the study; however, its pricing and utilization data were from 2013 to
2014 only.
*** Includes patients prescribed Myozyme.
Learn more about how Statista can support your business.
AHIP. (October 12, 2016). Percentage of annual utilization among select orphan drugs in the U.S. from 2012 to 2014, by usage type [Graph]. In Statista. Retrieved July 09, 2025, from https://www.statista.com/statistics/874132/orphan-drugs-utilization-by-usage/
AHIP. "Percentage of annual utilization among select orphan drugs in the U.S. from 2012 to 2014, by usage type." Chart. October 12, 2016. Statista. Accessed July 09, 2025. https://www.statista.com/statistics/874132/orphan-drugs-utilization-by-usage/
AHIP. (2016). Percentage of annual utilization among select orphan drugs in the U.S. from 2012 to 2014, by usage type. Statista. Statista Inc.. Accessed: July 09, 2025. https://www.statista.com/statistics/874132/orphan-drugs-utilization-by-usage/
AHIP. "Percentage of Annual Utilization among Select Orphan Drugs in The U.S. from 2012 to 2014, by Usage Type." Statista, Statista Inc., 12 Oct 2016, https://www.statista.com/statistics/874132/orphan-drugs-utilization-by-usage/
AHIP, Percentage of annual utilization among select orphan drugs in the U.S. from 2012 to 2014, by usage type Statista, https://www.statista.com/statistics/874132/orphan-drugs-utilization-by-usage/ (last visited July 09, 2025)
Percentage of annual utilization among select orphan drugs in the U.S. from 2012 to 2014, by usage type [Graph], AHIP, October 12, 2016. [Online]. Available: https://www.statista.com/statistics/874132/orphan-drugs-utilization-by-usage/
Advertisement
Profit from additional features with an Employee Account
Please create an employee account to be able to mark statistics as favorites.
Then you can access your favorite statistics via the star in the header.
Profit from the additional features of your individual account
Currently, you are using a shared account. To use individual functions (e.g., mark statistics as favourites, set
statistic alerts) please log in with your personal account.
If you are an admin, please authenticate by logging in again.