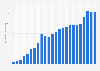
Home sales activity in San Diego, California, slowed down in 2022, with the number of residential transactions declining by more than 10,000. In 2022, the volume of home sales amounted to ******, down from ****** in the previous year.
Profit from the additional features of your individual account
Currently, you are using a shared account. To use individual functions (e.g., mark statistics as favourites, set
statistic alerts) please log in with your personal account.
If you are an admin, please authenticate by logging in again.
Learn more about how Statista can support your business.
first tuesday Journal. (August 10, 2023). Volume of homes sold in San Diego, California from 2015 to 2022 [Graph]. In Statista. Retrieved July 15, 2025, from https://www.statista.com/statistics/892592/home-sales-san-diego/
first tuesday Journal. "Volume of homes sold in San Diego, California from 2015 to 2022." Chart. August 10, 2023. Statista. Accessed July 15, 2025. https://www.statista.com/statistics/892592/home-sales-san-diego/
first tuesday Journal. (2023). Volume of homes sold in San Diego, California from 2015 to 2022. Statista. Statista Inc.. Accessed: July 15, 2025. https://www.statista.com/statistics/892592/home-sales-san-diego/
first tuesday Journal. "Volume of Homes Sold in San Diego, California from 2015 to 2022." Statista, Statista Inc., 10 Aug 2023, https://www.statista.com/statistics/892592/home-sales-san-diego/
first tuesday Journal, Volume of homes sold in San Diego, California from 2015 to 2022 Statista, https://www.statista.com/statistics/892592/home-sales-san-diego/ (last visited July 15, 2025)
Volume of homes sold in San Diego, California from 2015 to 2022 [Graph], first tuesday Journal, August 10, 2023. [Online]. Available: https://www.statista.com/statistics/892592/home-sales-san-diego/