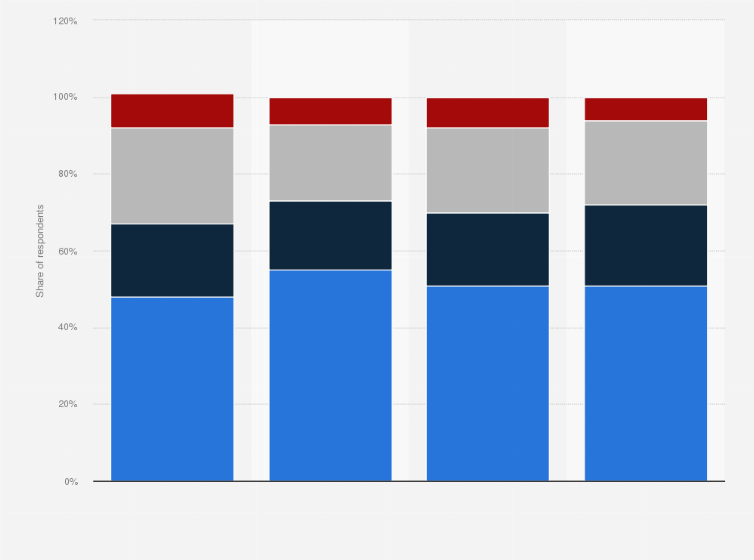
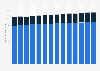
This statistic shows the frequency of at-home seafood consumption among consumers in the United States as of 2018, by region. According to the survey, some 51 percent of U.S. consumers in the Southwest region of the U.S. indicated that they consume seafood frequently.
Frequency of at-home seafood consumption among consumers in the United States as of 2018, by region
Adjust the presentation of the statistic and data points.
Share the statistic on social media channels or embed the statistic in your
website using "Embed Code", where available.
Cite this statistic and select one of the following formats: APA, Chicago, Harvard, MLA & Bluebook.
Print the statistic including description and metadata.
Chart type
Frequency of at-home seafood consumption among consumers in the United States as of 2018, by region
Share this statistic
You have no right to use this feature.
Make sure to contact us if you are interested in scientific citation.
You can upgrade your account to enable this functionality for all statistics.
This feature is not available with your current account.Request access
This question was phrased by the source as follows: "Please indicate how often you consume the following types of food at-home or at someone else’s home."
Learn more about how Statista can support your business.
Alaska Seafood Marketing Institute. (July 19, 2018). Frequency of at-home seafood consumption among consumers in the United States as of 2018, by region [Graph]. In Statista. Retrieved June 11, 2025, from https://www.statista.com/statistics/898889/frequency-of-us-consumers-seafood-consumption-by-region/
Alaska Seafood Marketing Institute. "Frequency of at-home seafood consumption among consumers in the United States as of 2018, by region." Chart. July 19, 2018. Statista. Accessed June 11, 2025. https://www.statista.com/statistics/898889/frequency-of-us-consumers-seafood-consumption-by-region/
Alaska Seafood Marketing Institute. (2018). Frequency of at-home seafood consumption among consumers in the United States as of 2018, by region. Statista. Statista Inc.. Accessed: June 11, 2025. https://www.statista.com/statistics/898889/frequency-of-us-consumers-seafood-consumption-by-region/
Alaska Seafood Marketing Institute. "Frequency of At-home Seafood Consumption among Consumers in The United States as of 2018, by Region." Statista, Statista Inc., 19 Jul 2018, https://www.statista.com/statistics/898889/frequency-of-us-consumers-seafood-consumption-by-region/
Alaska Seafood Marketing Institute, Frequency of at-home seafood consumption among consumers in the United States as of 2018, by region Statista, https://www.statista.com/statistics/898889/frequency-of-us-consumers-seafood-consumption-by-region/ (last visited June 11, 2025)
Frequency of at-home seafood consumption among consumers in the United States as of 2018, by region [Graph], Alaska Seafood Marketing Institute, July 19, 2018. [Online]. Available: https://www.statista.com/statistics/898889/frequency-of-us-consumers-seafood-consumption-by-region/
Profit from additional features with an Employee Account
Please create an employee account to be able to mark statistics as favorites.
Then you can access your favorite statistics via the star in the header.
Profit from the additional features of your individual account
Currently, you are using a shared account. To use individual functions (e.g., mark statistics as favourites, set
statistic alerts) please log in with your personal account.
If you are an admin, please authenticate by logging in again.