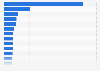
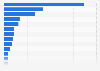
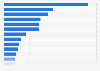
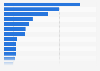
This statistic shows the preferred custom made furniture items in China as of 2018. During the survey period, around 87.7 percent of respondents in China said they preferred buying a custom made kitchen cabinet.
Advertisement
Advertisement
Preference of custom made furniture items in China as of 2018, by items
Profit from the additional features of your individual account
Currently, you are using a shared account. To use individual functions (e.g., mark statistics as favourites, set
statistic alerts) please log in with your personal account.
If you are an admin, please authenticate by logging in again.
Learn more about how Statista can support your business.
Ebrun. (May 8, 2018). Preference of custom made furniture items in China as of 2018, by items [Graph]. In Statista. Retrieved June 13, 2025, from https://www.statista.com/statistics/901020/china-preferred-custom-made-furniture-products-by-type/
Ebrun. "Preference of custom made furniture items in China as of 2018, by items." Chart. May 8, 2018. Statista. Accessed June 13, 2025. https://www.statista.com/statistics/901020/china-preferred-custom-made-furniture-products-by-type/
Ebrun. (2018). Preference of custom made furniture items in China as of 2018, by items. Statista. Statista Inc.. Accessed: June 13, 2025. https://www.statista.com/statistics/901020/china-preferred-custom-made-furniture-products-by-type/
Ebrun. "Preference of Custom Made Furniture Items in China as of 2018, by Items." Statista, Statista Inc., 8 May 2018, https://www.statista.com/statistics/901020/china-preferred-custom-made-furniture-products-by-type/
Ebrun, Preference of custom made furniture items in China as of 2018, by items Statista, https://www.statista.com/statistics/901020/china-preferred-custom-made-furniture-products-by-type/ (last visited June 13, 2025)
Preference of custom made furniture items in China as of 2018, by items [Graph], Ebrun, May 8, 2018. [Online]. Available: https://www.statista.com/statistics/901020/china-preferred-custom-made-furniture-products-by-type/