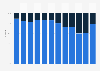
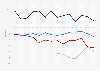
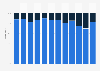
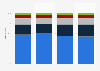
This statistic shows the share of minorities in the U.S. House of Representatives from 1967 to 2017, by party membership. In 2017, 45.7 percent of Democrats in the House of Representatives were minorities, compared to 6.7 percent of Republicans.
Advertisement
Advertisement
Share of minorities in the U.S. House of Representatives from 1967-2017, by party membership
Profit from the additional features of your individual account
Currently, you are using a shared account. To use individual functions (e.g., mark statistics as favourites, set
statistic alerts) please log in with your personal account.
If you are an admin, please authenticate by logging in again.
Learn more about how Statista can support your business.
Axios. (September 25, 2018). Share of minorities in the U.S. House of Representatives from 1967-2017, by party membership [Graph]. In Statista. Retrieved June 24, 2025, from https://www.statista.com/statistics/917125/share-of-minorities-us-house-of-representatives-by-party-membership/
Axios. "Share of minorities in the U.S. House of Representatives from 1967-2017, by party membership." Chart. September 25, 2018. Statista. Accessed June 24, 2025. https://www.statista.com/statistics/917125/share-of-minorities-us-house-of-representatives-by-party-membership/
Axios. (2018). Share of minorities in the U.S. House of Representatives from 1967-2017, by party membership. Statista. Statista Inc.. Accessed: June 24, 2025. https://www.statista.com/statistics/917125/share-of-minorities-us-house-of-representatives-by-party-membership/
Axios. "Share of Minorities in The U.S. House of Representatives from 1967-2017, by Party Membership." Statista, Statista Inc., 25 Sep 2018, https://www.statista.com/statistics/917125/share-of-minorities-us-house-of-representatives-by-party-membership/
Axios, Share of minorities in the U.S. House of Representatives from 1967-2017, by party membership Statista, https://www.statista.com/statistics/917125/share-of-minorities-us-house-of-representatives-by-party-membership/ (last visited June 24, 2025)
Share of minorities in the U.S. House of Representatives from 1967-2017, by party membership [Graph], Axios, September 25, 2018. [Online]. Available: https://www.statista.com/statistics/917125/share-of-minorities-us-house-of-representatives-by-party-membership/