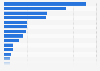
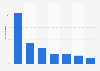
In 2022, the Buenos Aires Metropolitan Area (AMBA, as abbreviated in Spanish) concentrated 38 percent of the total e-commerce revenue in Argentina. The central region of the country (including the provinces of La Pampa, Córdoba, and the rest of Buenos Aires) accounted for 32 percent of the online sales revenue that year. Most digital consumers surveyed in Argentina said they shop online because it is easy and simple.
* Figures include the autonomous city of Buenos Aires and the adjacent 24 partidos in the Province of Buenos Aires. ** Number of respondents in 2022.
Data preceding 2020 was retrieved from earlier releases. Original question: 'You said that your total billing was... Please distribute this amount by zone according to your sales' Percentage points exceeding or missing to 100 percent are probably due to rounding.
Profit from the additional features of your individual account
Currently, you are using a shared account. To use individual functions (e.g., mark statistics as favourites, set
statistic alerts) please log in with your personal account.
If you are an admin, please authenticate by logging in again.
Learn more about how Statista can support your business.
CACE. (March 1, 2023). Distribution of e-commerce sales revenue in Argentina from 2016 to 2022, by region [Graph]. In Statista. Retrieved July 08, 2025, from https://www.statista.com/statistics/917138/e-commerce-sales-distribution-region-argentina/
CACE. "Distribution of e-commerce sales revenue in Argentina from 2016 to 2022, by region." Chart. March 1, 2023. Statista. Accessed July 08, 2025. https://www.statista.com/statistics/917138/e-commerce-sales-distribution-region-argentina/
CACE. (2023). Distribution of e-commerce sales revenue in Argentina from 2016 to 2022, by region. Statista. Statista Inc.. Accessed: July 08, 2025. https://www.statista.com/statistics/917138/e-commerce-sales-distribution-region-argentina/
CACE. "Distribution of E-commerce Sales Revenue in Argentina from 2016 to 2022, by Region." Statista, Statista Inc., 1 Mar 2023, https://www.statista.com/statistics/917138/e-commerce-sales-distribution-region-argentina/
CACE, Distribution of e-commerce sales revenue in Argentina from 2016 to 2022, by region Statista, https://www.statista.com/statistics/917138/e-commerce-sales-distribution-region-argentina/ (last visited July 08, 2025)
Distribution of e-commerce sales revenue in Argentina from 2016 to 2022, by region [Graph], CACE, March 1, 2023. [Online]. Available: https://www.statista.com/statistics/917138/e-commerce-sales-distribution-region-argentina/