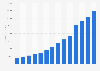
In 2023, the average annual revenue per employee of professional services within software as a service was roughly 175,000 U.S. dollars. The average annual revenue per employee of professional services within software as a service (SaaS) companies worldwide fluctuated considerably between 2015 and 2023. In 2023, employees generated approximately 50,000 U.S. dollars more than in 2015.
Average revenue per employee of professional services within software as a service (SaaS) companies worldwide from 2015 to 2023
(in 1,000 U.S. dollars)
Characteristic
Annual revenue per employee in thousand U.S. dollars
2023
175
2022
145
2021
161
2020
166
2019
199
2018
154
2017
157
2016
151
2015
170
050100150200250
Add this content to your personal favorites. These can be accessed from the favorites menu in the main navigation.
You have no right to use this feature.
Make sure to contact us if you are interested in scientific citation.
You can upgrade your account to enable this functionality for all statistics.
This feature is not available with your current account.Request access
Learn more about how Statista can support your business.
Sage. (February 13, 2024). Average revenue per employee of professional services within software as a service (SaaS) companies worldwide from 2015 to 2023 (in 1,000 U.S. dollars) [Graph]. In Statista. Retrieved May 13, 2025, from https://www.statista.com/statistics/936949/saas-professional-services-worldwide-revenue-per-employee/
Sage. "Average revenue per employee of professional services within software as a service (SaaS) companies worldwide from 2015 to 2023 (in 1,000 U.S. dollars)." Chart. February 13, 2024. Statista. Accessed May 13, 2025. https://www.statista.com/statistics/936949/saas-professional-services-worldwide-revenue-per-employee/
Sage. (2024). Average revenue per employee of professional services within software as a service (SaaS) companies worldwide from 2015 to 2023 (in 1,000 U.S. dollars). Statista. Statista Inc.. Accessed: May 13, 2025. https://www.statista.com/statistics/936949/saas-professional-services-worldwide-revenue-per-employee/
Sage. "Average Revenue per Employee of Professional Services within Software as a Service (Saas) Companies Worldwide from 2015 to 2023 (in 1,000 U.S. Dollars)." Statista, Statista Inc., 13 Feb 2024, https://www.statista.com/statistics/936949/saas-professional-services-worldwide-revenue-per-employee/
Sage, Average revenue per employee of professional services within software as a service (SaaS) companies worldwide from 2015 to 2023 (in 1,000 U.S. dollars) Statista, https://www.statista.com/statistics/936949/saas-professional-services-worldwide-revenue-per-employee/ (last visited May 13, 2025)
Average revenue per employee of professional services within software as a service (SaaS) companies worldwide from 2015 to 2023 (in 1,000 U.S. dollars) [Graph], Sage, February 13, 2024. [Online]. Available: https://www.statista.com/statistics/936949/saas-professional-services-worldwide-revenue-per-employee/
Profit from additional features with an Employee Account
Please create an employee account to be able to mark statistics as favorites.
Then you can access your favorite statistics via the star in the header.
Profit from the additional features of your individual account
Currently, you are using a shared account. To use individual functions (e.g., mark statistics as favourites, set
statistic alerts) please log in with your personal account.
If you are an admin, please authenticate by logging in again.