The source adds the following information: The data cover the 'non-financial business economy', which includes industry, construction, trade, and services (NACE Rev. 2 sections B to J, L, M and N), but not enterprises in agriculture, forestry and fisheries and the largely non-market service sectors such as education and health. The following size-class definitions are applied: micro firms (0-9 persons employed), small firms (10-49 persons employed), medium-sized firms (50-249 persons employed), and large firms (250+ persons employed). The advantage of using Eurostat data is that the statistics are harmonised and comparable across countries. The disadvantage is that for some countries the data may be different from those published by national authorities.
Profit from the additional features of your individual account
Currently, you are using a shared account. To use individual functions (e.g., mark statistics as favourites, set
statistic alerts) please log in with your personal account.
If you are an admin, please authenticate by logging in again.
Learn more about how Statista can support your business.
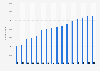
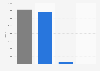
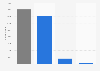
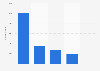
European Commission. (June 20, 2022). Value added by small and medium-sized enterprises (SMEs) in Lithuania from 2008 to 2022, by enterprise size (in million Euro) [Graph]. In Statista. Retrieved June 15, 2025, from https://www.statista.com/statistics/937777/value-added-by-smes-in-lithuania/
European Commission. "Value added by small and medium-sized enterprises (SMEs) in Lithuania from 2008 to 2022, by enterprise size (in million Euro)." Chart. June 20, 2022. Statista. Accessed June 15, 2025. https://www.statista.com/statistics/937777/value-added-by-smes-in-lithuania/
European Commission. (2022). Value added by small and medium-sized enterprises (SMEs) in Lithuania from 2008 to 2022, by enterprise size (in million Euro). Statista. Statista Inc.. Accessed: June 15, 2025. https://www.statista.com/statistics/937777/value-added-by-smes-in-lithuania/
European Commission. "Value Added by Small and Medium-sized Enterprises (Smes) in Lithuania from 2008 to 2022, by Enterprise Size (in Million Euro)." Statista, Statista Inc., 20 Jun 2022, https://www.statista.com/statistics/937777/value-added-by-smes-in-lithuania/
European Commission, Value added by small and medium-sized enterprises (SMEs) in Lithuania from 2008 to 2022, by enterprise size (in million Euro) Statista, https://www.statista.com/statistics/937777/value-added-by-smes-in-lithuania/ (last visited June 15, 2025)
Value added by small and medium-sized enterprises (SMEs) in Lithuania from 2008 to 2022, by enterprise size (in million Euro) [Graph], European Commission, June 20, 2022. [Online]. Available: https://www.statista.com/statistics/937777/value-added-by-smes-in-lithuania/