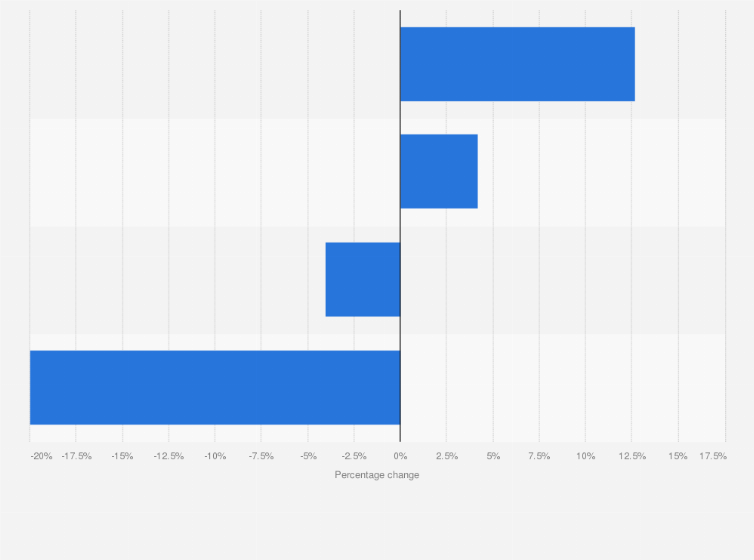
This statistic depicts the annual percentage change in payment methods across Australia in financial year 2018, by type. During this financial year, the use of checks as a payment method in Australia decreased by around 20 percent compared to the previous financial year.
Advertisement
Advertisement
Annual percentage change in payment methods across Australia in financial year 2018, by type
Adjust the presentation of the statistic and data points.
Share the statistic on social media channels or embed the statistic in your
website using "Embed Code", where available.
Cite this statistic and select one of the following formats: APA, Chicago, Harvard, MLA & Bluebook.
Print the statistic including description and metadata.
Chart type
Annual percentage change in payment methods across Australia in financial year 2018, by type
Share this statistic
You have no right to use this feature.
Make sure to contact us if you are interested in scientific citation.
You can upgrade your account to enable this functionality for all statistics.
This feature is not available with your current account.Request access
Australia's financial years run from July to June of the following year. For example, FY 2018 starts on July 1, 2017 and ends on June 30, 2018.
Supplementary notes
*Direct entry is a payments system for direct debits and direct credits. Direct entry payments refer to a system commonly used by businesses to make recurring, automated payments to and from everyday transaction accounts. These include salary and welfare payments (direct credits), insurance premiums and utility bills (direct debits), and internet (Pay Anyone) banking services.
Learn more about how Statista can support your business.
Australian Payments Network. (October 22, 2018). Annual percentage change in payment methods across Australia in financial year 2018, by type [Graph]. In Statista. Retrieved June 15, 2025, from https://www.statista.com/statistics/940489/australia-annual-change-payment-methods-by-type/
Australian Payments Network. "Annual percentage change in payment methods across Australia in financial year 2018, by type." Chart. October 22, 2018. Statista. Accessed June 15, 2025. https://www.statista.com/statistics/940489/australia-annual-change-payment-methods-by-type/
Australian Payments Network. (2018). Annual percentage change in payment methods across Australia in financial year 2018, by type. Statista. Statista Inc.. Accessed: June 15, 2025. https://www.statista.com/statistics/940489/australia-annual-change-payment-methods-by-type/
Australian Payments Network. "Annual Percentage Change in Payment Methods across Australia in Financial Year 2018, by Type." Statista, Statista Inc., 22 Oct 2018, https://www.statista.com/statistics/940489/australia-annual-change-payment-methods-by-type/
Australian Payments Network, Annual percentage change in payment methods across Australia in financial year 2018, by type Statista, https://www.statista.com/statistics/940489/australia-annual-change-payment-methods-by-type/ (last visited June 15, 2025)
Annual percentage change in payment methods across Australia in financial year 2018, by type [Graph], Australian Payments Network, October 22, 2018. [Online]. Available: https://www.statista.com/statistics/940489/australia-annual-change-payment-methods-by-type/
Advertisement
Profit from additional features with an Employee Account
Please create an employee account to be able to mark statistics as favorites.
Then you can access your favorite statistics via the star in the header.
Profit from the additional features of your individual account
Currently, you are using a shared account. To use individual functions (e.g., mark statistics as favourites, set
statistic alerts) please log in with your personal account.
If you are an admin, please authenticate by logging in again.